English
Back
Download
Log in to access Online Inquiry
Back to the Top
Quantum Computing Boom: The next AI?
Views 10.9M Contents 508

1.9Individual stock analysis

avatar
Dreamboat joined discussion · 11 hours ago
1.9Individual stock analysis
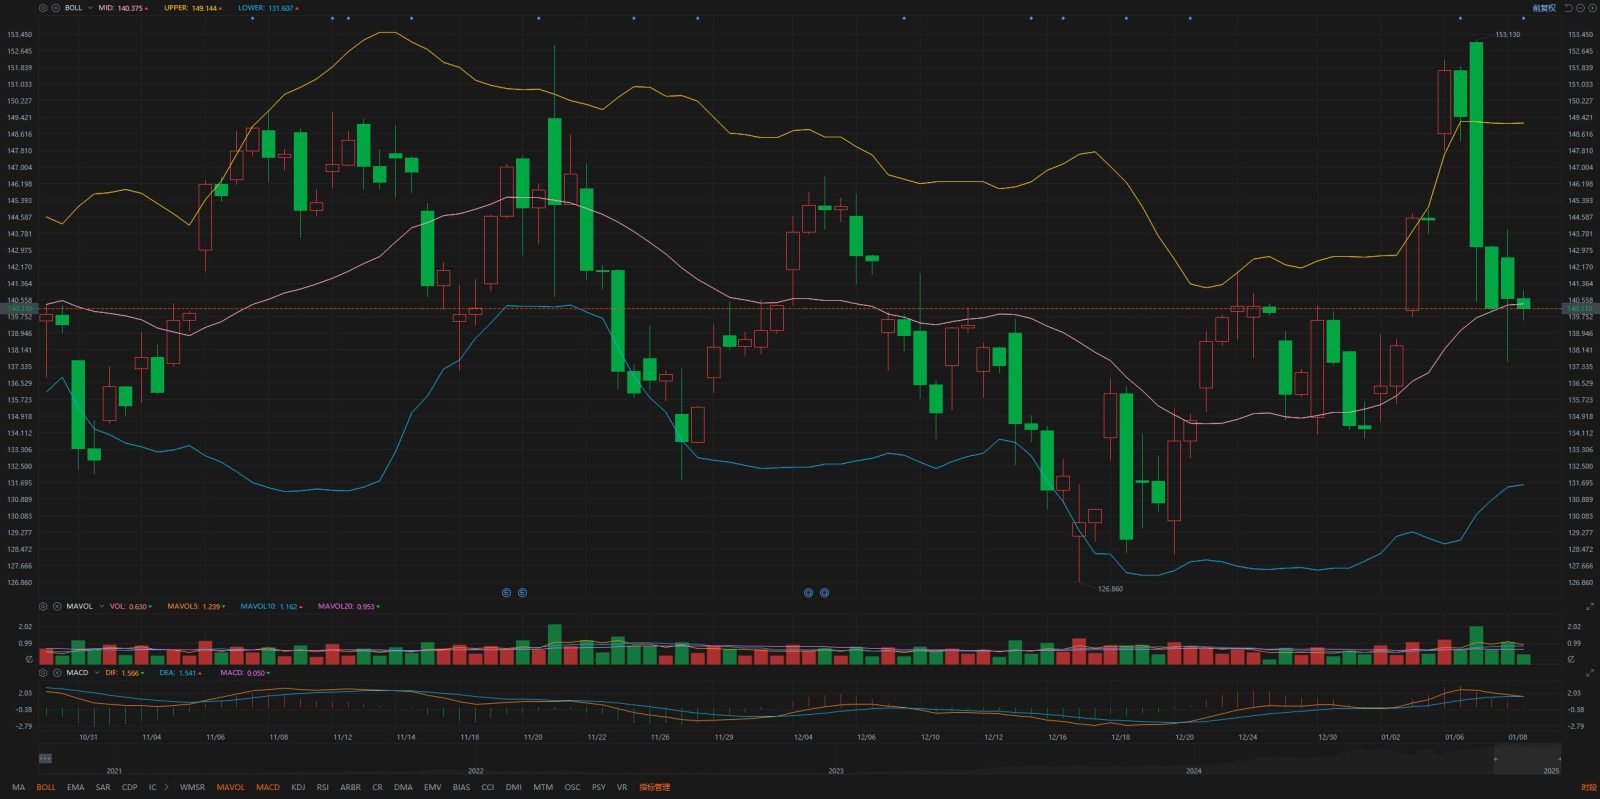
Last night felt like a "sports car hitting the brakes" — not moving an inch, yet thanks to the CEO's remarks, quantum concept stocks took a dive. It’s hard not to marvel at the phrase: "Standing still like a mountain, yet inflicting damage on thousands."
On the chart, the stock has fallen into a consolidation phase, with bulls and bears battling fiercely around the $140 mark. The price is below the 5-day and 10-day moving averages, signaling short-term weakness, but key support levels remain intact. It’s hovering near the middle Bollinger Band, with resistance at the upper band around $149 and support at the lower band near $131.5. The short-term trend remains range-bound, with no clear breakout direction yet.
Trading Tips: The trend remains choppy, and the breakout direction is still uncertain.
1.9Individual stock analysis
Calm on the surface, but turbulent underneath! Especially with the 2025 car price war in full swing, whether Tesla can continue to "carry the flag" has become a key focus for the market.
On the chart, the stock is hovering near the middle Bollinger Band, showing a short-term sideways trend. Support Level: Strong support has formed around $390. Resistance Level: The first hurdle for the bulls lies at $405.
Trading Tips: If $390 holds and volume pushes the stock above $405, the bulls could launch a new wave of momentum.
1.9Individual stock analysis
A staggering 45.41% drop—this is nothing short of a "quantum storm" that caught the market off guard. NVIDIA's CEO’s "insight" clearly lit the fuse, triggering a collective reshuffle in quantum computing stocks.
On the chart, the candlestick has taken a nosedive from its high, with the stock price almost "resetting to zero," breaking below all moving average supports. The support near the lower Bollinger Band is beginning to show strength, and the stock is now approaching technically oversold territory, suggesting potential for a short-term rebound.
Trading Tips: If the $9.5 support holds, the bulls might attempt a comeback in the $10.5–$12 range.
@AMD
1.9Individual stock analysis
The global PC market has seen continuous declines in shipments over the past few months, which isn’t exactly good news for a company like AMD, heavily reliant on the PC CPU market. But to be fair, this market-wide slump isn’t entirely AMD’s fault—after all, even their competitor Intel is "eating dirt."
On the chart, the stock is hovering near the lower Bollinger Band, with the overall technical pattern looking weak. The appearance of a large bearish candle indicates that short-term bears are in control. Market sentiment is cautious, and the increased trading volume on the down day suggests a clear outflow of funds.
Trading Tips: In the short term, the stock is likely to remain range-bound between $115 and $125.

The above is purely personal analysis and for reference only; it does not constitute investment advice.
Disclaimer: Community is offered by Moomoo Technologies Inc. and is for educational purposes only. Read more
12
+0
Translate
Report
49K Views
Comment
Sign in to post a comment