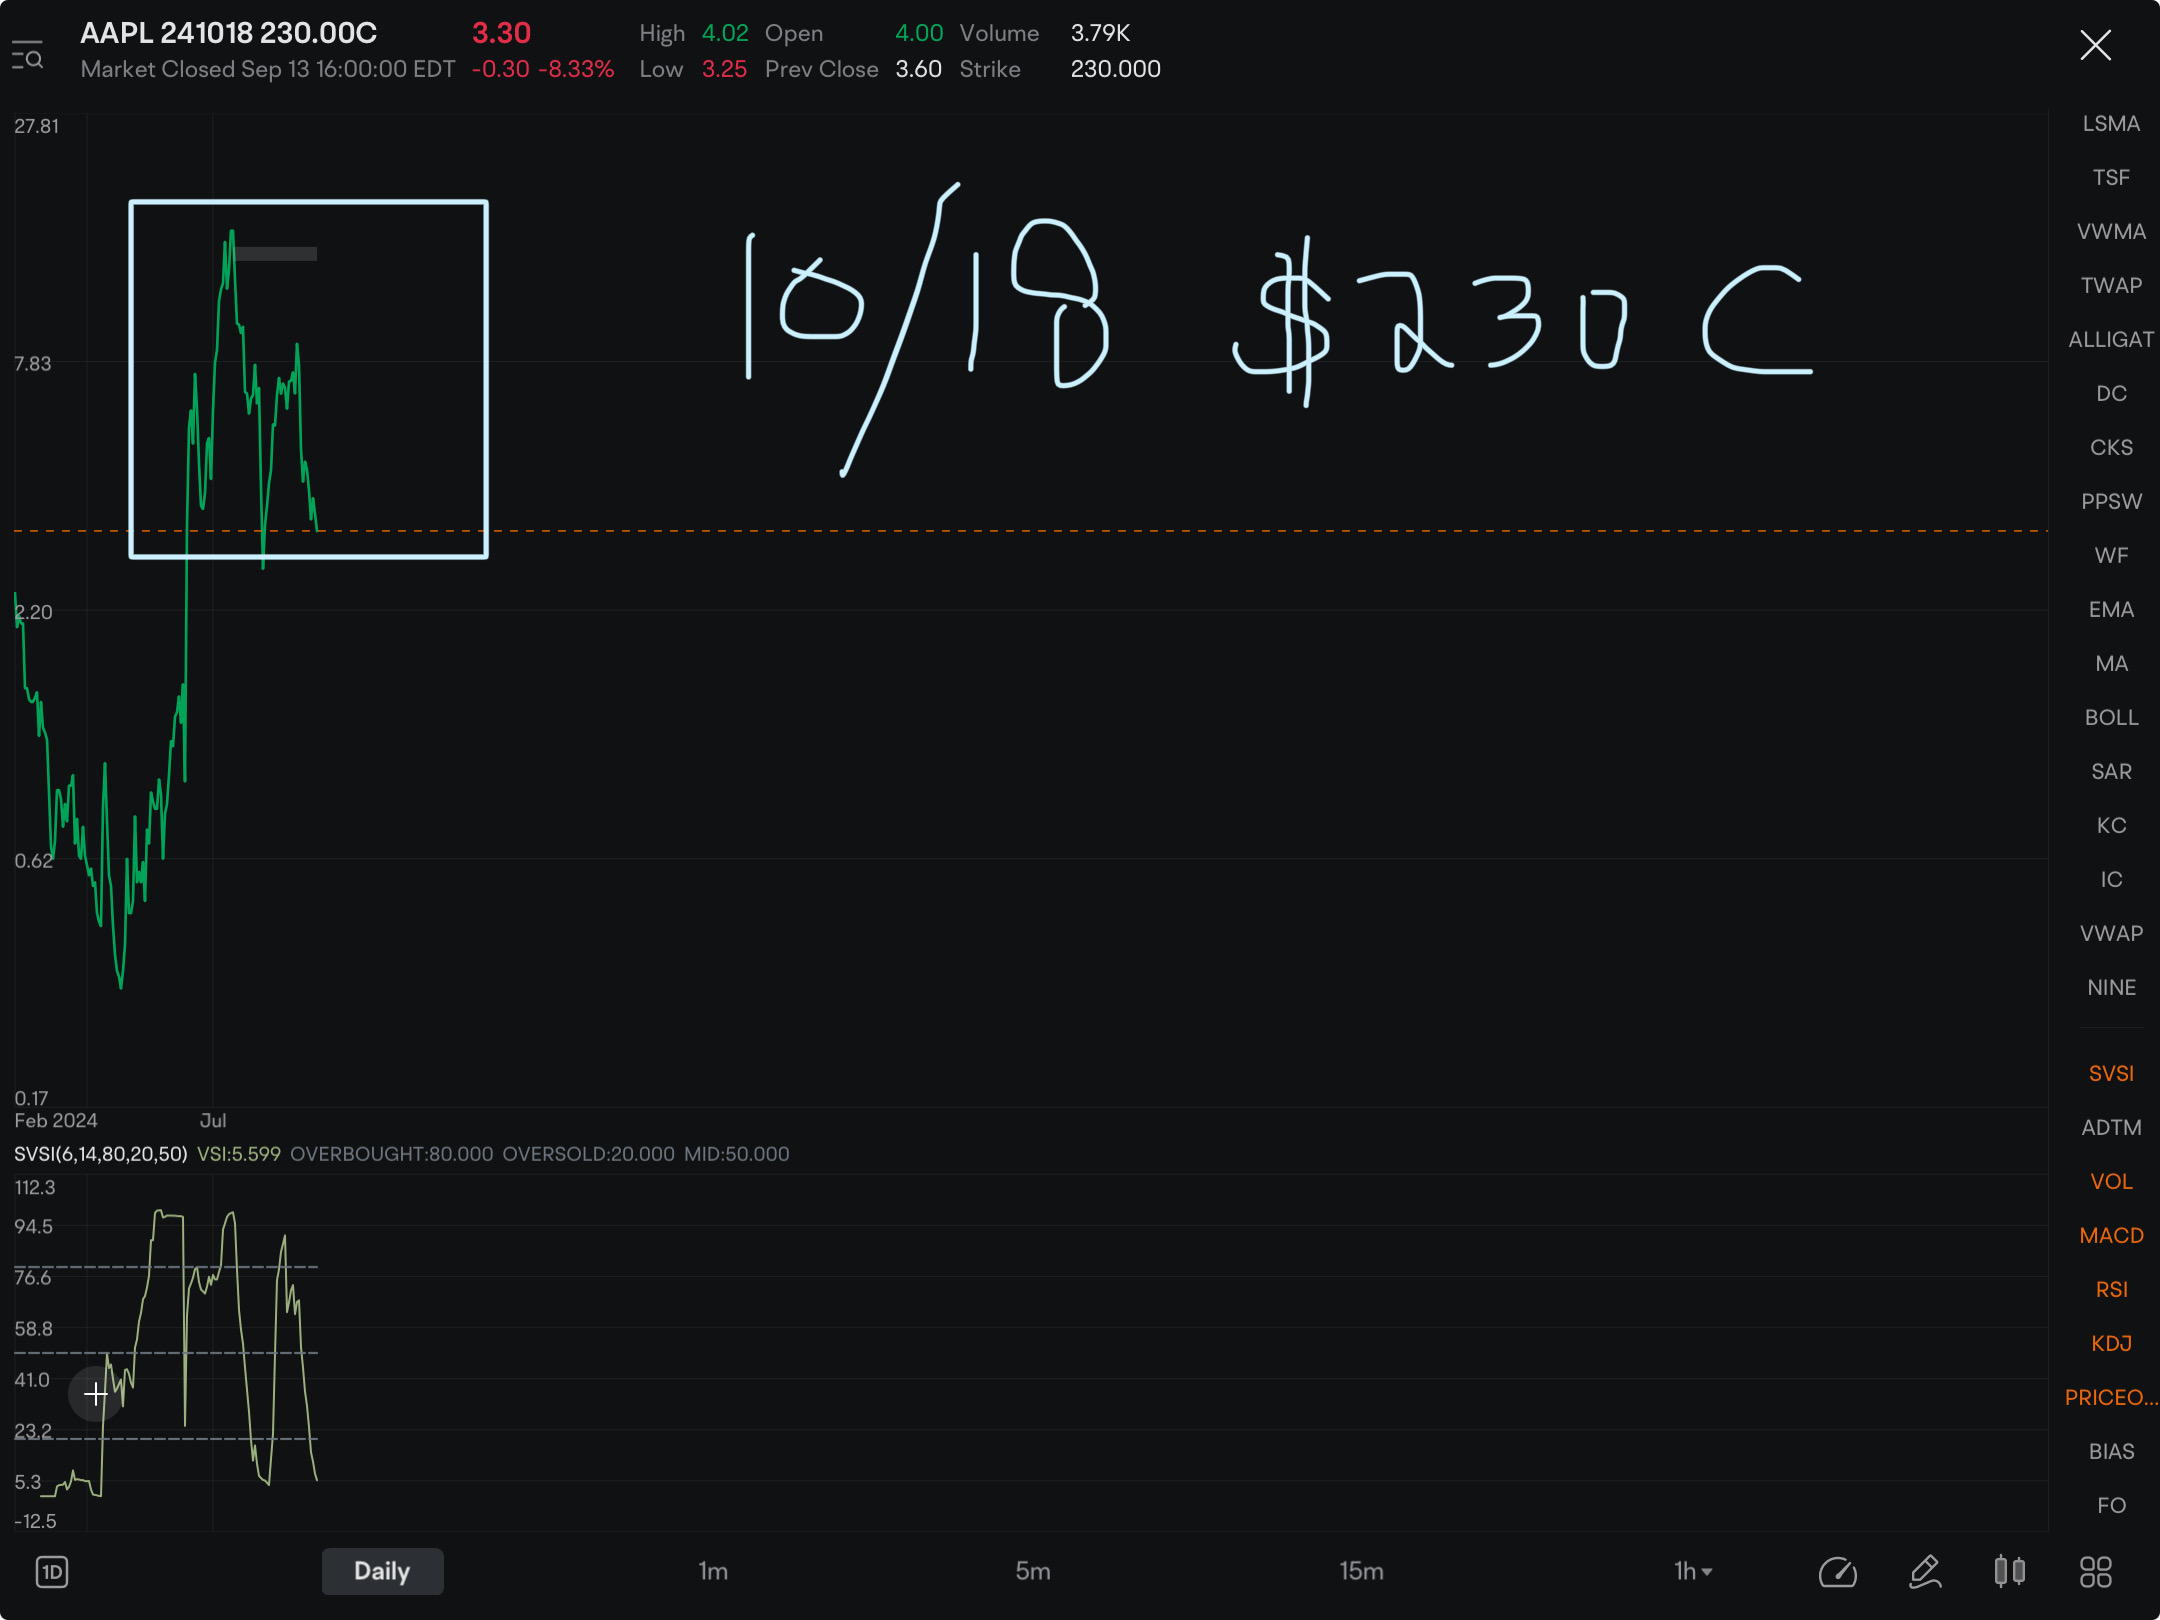
A lot of times charts of strike points on options chain can be very telling of future movement of underlying. For example this chart, 10/18 exp $230 strike CALL looks like a clear double top.
$AAPL 241018 230.00C$ $Apple (AAPL.US)$ $Invesco QQQ Trust (QQQ.US)$ (one could also argue their is a head and shoulders setup in there)
Could be wrong, just wanted to mention how useful it can be to view charts along the option chain.

Disclaimer: Community is offered by Moomoo Technologies Inc. and is for educational purposes only.
Read more
Comment
Sign in to post a comment

Laine Ford : all stock is good