$APLD

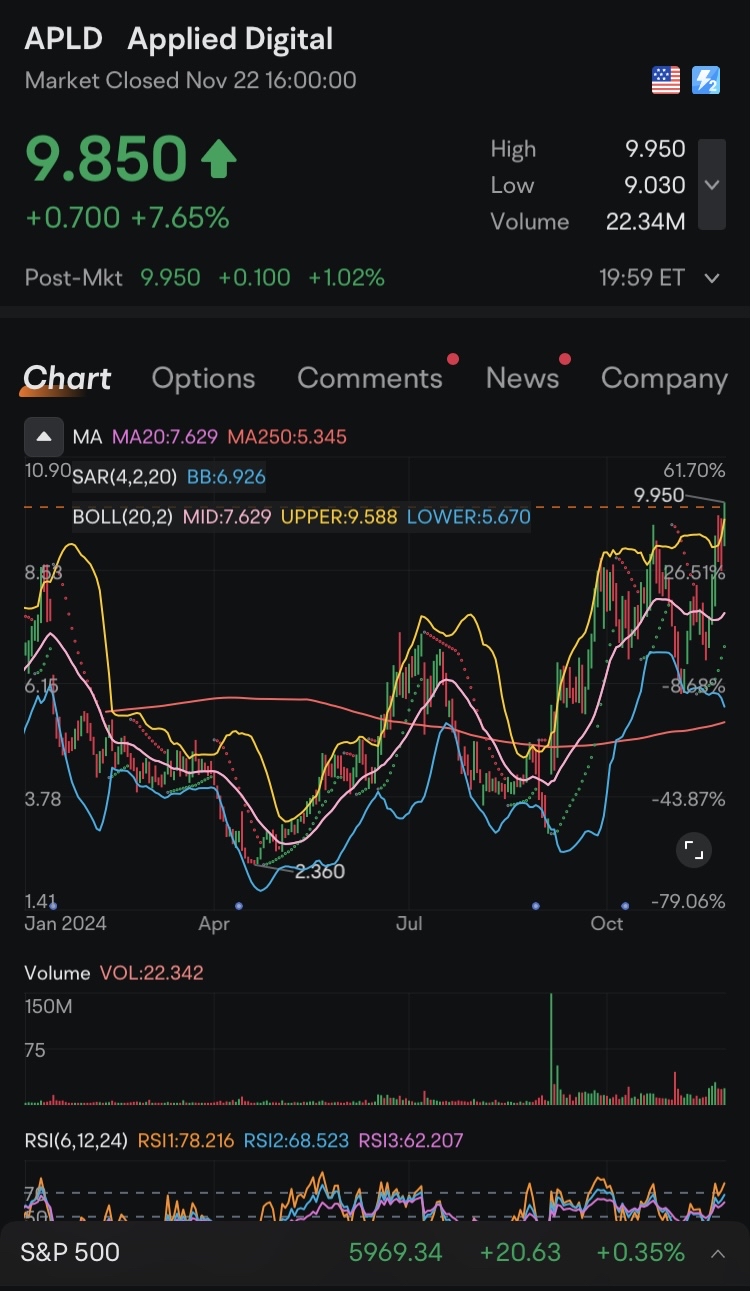
🚀 $APLD is soaring! Breaking out with a 7.65% gain today, trading above the 20-day & 250-day MAs with massive volume. Bullish momentum is strong, with a breakout above $10 targeting $12+ next! 📈🔥
1. Price Performance
• Current Price: $9.85 (+7.65% for the day)
• The price closed near the day’s high of $9.95, showing strong bullish momentum.
• The stock is in a clear uptrend, having recently broken out above resistance levels.
2. Moving Averages (MA)
• MA20: $7.63
• MA250: $5.35
• The stock is trading significantly above both the 20-day and 250-day moving averages, indicating strong upward momentum and a confirmed bullish trend.
3. Bollinger Bands (BB)
• Upper Band: $9.59
• Lower Band: $5.67
• The price is trading above the upper Bollinger Band, often a sign of strong buying momentum. However, this could also suggest overextension, meaning a potential pullback in the short term.
4. Relative Strength Index (RSI)
• RSI1: 78.22 (Overbought)
• RSI2: 68.52
• RSI3: 62.21
• The RSI indicates the stock is in the overbought zone, signaling high bullish momentum but also a risk of short-term correction.
5. Volume
• Volume: 22.34M
• The high volume supports the uptrend and suggests strong investor interest.
6. Support and Resistance
• Support: Around $7.63 (MA20) and $5.67 (Lower Bollinger Band)
• Resistance: The next major resistance is psychological at $10.00.
Summary
• Bullish Indicators: The stock is in a strong uptrend, trading above major moving averages and breaking resistance levels. High volume supports the bullish sentiment.
• Caution: The RSI indicates overbought conditions, so a short-term pullback is possible.
• Swing Trade Outlook: Ideal for bullish strategies like vertical call spreads, targeting a price move toward $10–$12.
Keep an eye on volume and any consolidation near $9.50–$10 before taking action.
Disclaimer: Community is offered by Moomoo Technologies Inc. and is for educational purposes only.
Read more
Comment
Sign in to post a comment
