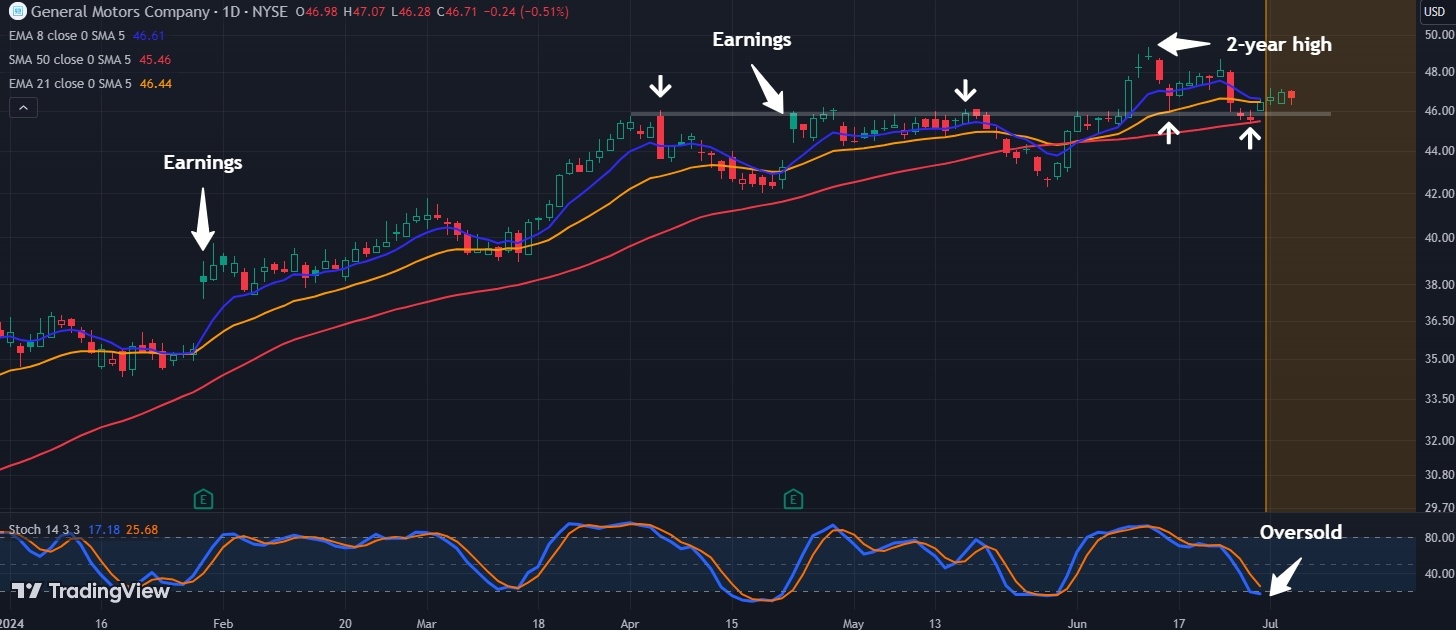
General Motors Rallied. Now it’s Pulled Back.
General Motors recently hit a two-year year high, and some traders may see opportunity in its latest pullback.

The first pattern on today’s chart is the price area between roughly $45.70 and $46. The automaker stalled at this level in early April and remained below it all of May. It then broke out sharply on June 10 and has remained above it since. GM tested the zone last week and bounced. Has old resistance become new support?
Second, a pair of bullish gaps after the last two quarterly reports may reflect positive fundamentals.
Third, stochastics have dipped to an oversold condition.
Finally, prices have remained above the 50-day simple moving average. The 8-day exponential moving average (EMA) is also above the 21-day EMA. Those patterns may suggest GM has bullish intermediate and short-term trends.
Disclaimer: Community is offered by Moomoo Technologies Inc. and is for educational purposes only.
Read more
Comment
Sign in to post a comment
