Account Info
Log Out
English
Back
Log in to access Online Inquiry
Back to the Top

Indicator introduction: RSI's technical indicator, used to i...

Indicator introduction: RSI's technical indicator, used to identify overbought and oversold regions in stocks.

Step 1: Download the MoomoOPC version

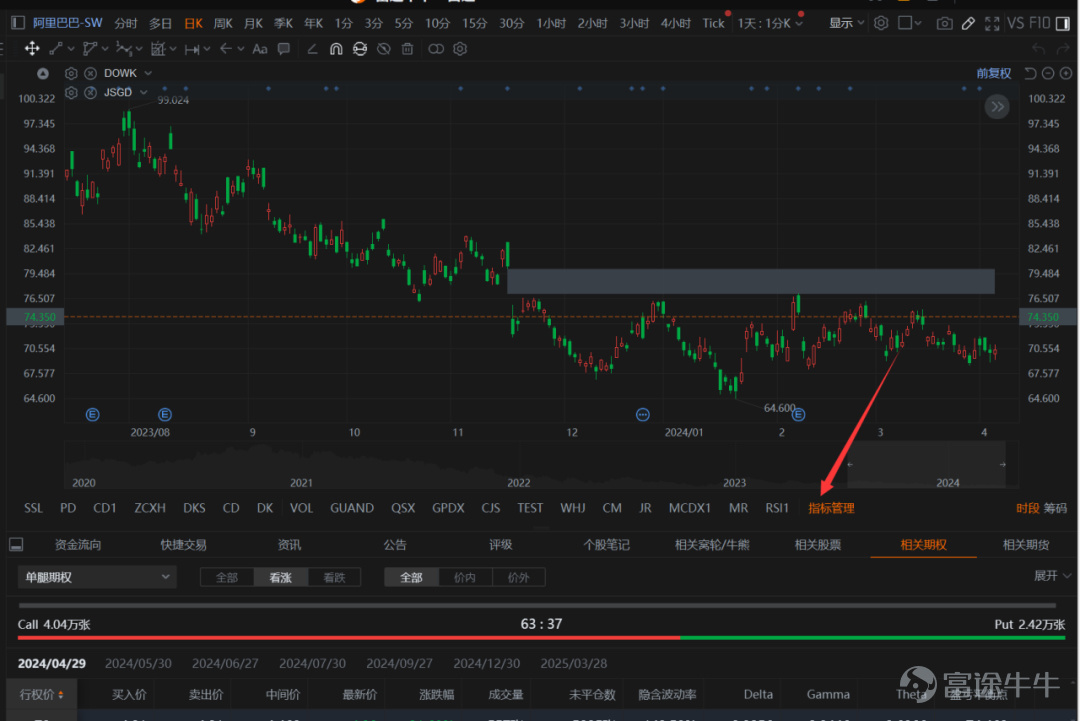
Step 2. Click “Index Management” in the lower right corner
Indicator introduction: RSI's technical indicator, used to identify overbought and oversold regions in stocks.  Step 1: Download the MoomoOPC version  Step 2. C...
Step 3. Click ➕ above to create a new indicator and copy the following code into the code box
LC: =REF (CLOSE,1); TEMP1: =MAX (CLOSE-LC,0); TEMP2: =ABS (CLOSE-LC); RSI1: SMA (TEMP1,14,1) /SMA (TEMP2,14,1) *100, COLORFF8D1E; 30, DOTLINE; 50, DOTLINE; 70, DOTLINE; N: =3; A1: =REF (RSI1, N) =HHV (RSI1, 2*N+1) ); B1: =BACKSET (A1, N+1); C1: =FILTER (B1, N); PERIOD_TOP: =BARSLAST (REF (C1,1)); TOP_DIV: =REF (CLOSE, PERIOD_TOP+1) RSI1 AND C1; DRAWLINE (REF (C1,1), REF (RSI1,1), FILTER (TOP_DIV,5), RSI1,0), COLORBLUE, LINETHICK3; FILLRGN (RSI1,70, RSI1>=70), COLORRED; A2: =REF (RSI1, N) =LLV (RSI1, N+1); B2: =BACKSET (A2, N+1); C2: =FILTER (B2, N); PERIOD_BOT: =BARSLAST (REF (C2,1)); BOT_DIV: =REF (CLOSE, PERIOD_BOT+1) > CLOSE AND REF (RSI1, PERIOD_BOT+1) <RSI1 AND C2;
DRAWLINE (REF (C2,1), REF (RSI1,1), FILTER (BOT_DIV,5), RSI1,0), COLORRED, LINETHICK3;
FILLRGN (RSI1,30, RSI1<=30), COLORGREEN;
Abbreviation: RSI1

Full name: Overbought Oversold

The object is: image

Then just click Test App.

Note: Because the system has its own RSI indicator, we will also conflict if we use RSI here, so we use RSI1.
Indicator introduction: RSI's technical indicator, used to identify overbought and oversold regions in stocks.  Step 1: Download the MoomoOPC version  Step 2. C...
The same account is automatically synced to different terminals, that is, if you add indicators to the PC version and log in to the phone with the same account, you can see the newly added indicators, and just call them up directly.

If an error is reported, check if you have entered full-width punctuation, and change all the codes to English input methods and re-enter them.

Indicator usage:

Next, I'll explain the principles of the code to you

The RSI indicator measures the relative strength or weakness of a security's price momentum. It is calculated by calculating the average of the increase and decrease. The value of RSI1 is between 0 and 100 and is generally assumed to be:

When RSI1 is above 70, the securities may be overbought.

When RSI1 falls below 30, securities may be oversold.

The results are as follows:
Indicator introduction: RSI's technical indicator, used to identify overbought and oversold regions in stocks.  Step 1: Download the MoomoOPC version  Step 2. C...
Since the RSI indicator is highly practical, it is loved by most investors. Although the RSI indicator has many advantages such as being able to send early buy or sell signals ahead of other technical indicators, investors should be aware that RSI can also send misleading information. Due to various reasons, the indicator also has blind spots in actual application. There is no perfect technical analysis tool in the current market, and so is RSI. Compared with Futubull Niu's own RSI, our indicator can identify overbought and oversold at a glance, diverging from top to bottom, and suitable for novice Xiaobai.

The indicator cannot determine the rise or fall of the stock price; changes in the stock price are the fundamental factors that determine the operation of the indicator. The most important function of the RSI indicator is that it can show the basic trend of the current market, indicate whether the market is strong or weak, or in a sideways market, and can also roughly predict whether the peak or bottom will arrive. However, the RSI indicator can only be a signal given after observing the market from a certain perspective. What it can provide investors with is only an auxiliary reference, which does not mean that the market trend will necessarily develop in the direction indicated by the RSI indicator. Especially when the market fluctuates violently, other indicators should also be used for comprehensive analysis; it is not possible to simply rely on RSI signals to make trading decisions.

For newbies, the balance of positions, trading, and mentality are particularly important. Read more, study more, and find out your own investment strategy! $NVIDIA(NVDA.US)$ $Apple(AAPL.US)$ $Direxion Daily Semiconductor Bull 3x Shares ETF(SOXL.US)$
Disclaimer: Community is offered by Moomoo Technologies Inc. and is for educational purposes only. Read more
5
1
+0
See Original
Report
29K Views
Comment
Sign in to post a comment
    3Followers
    0Following
    23Visitors
    Follow