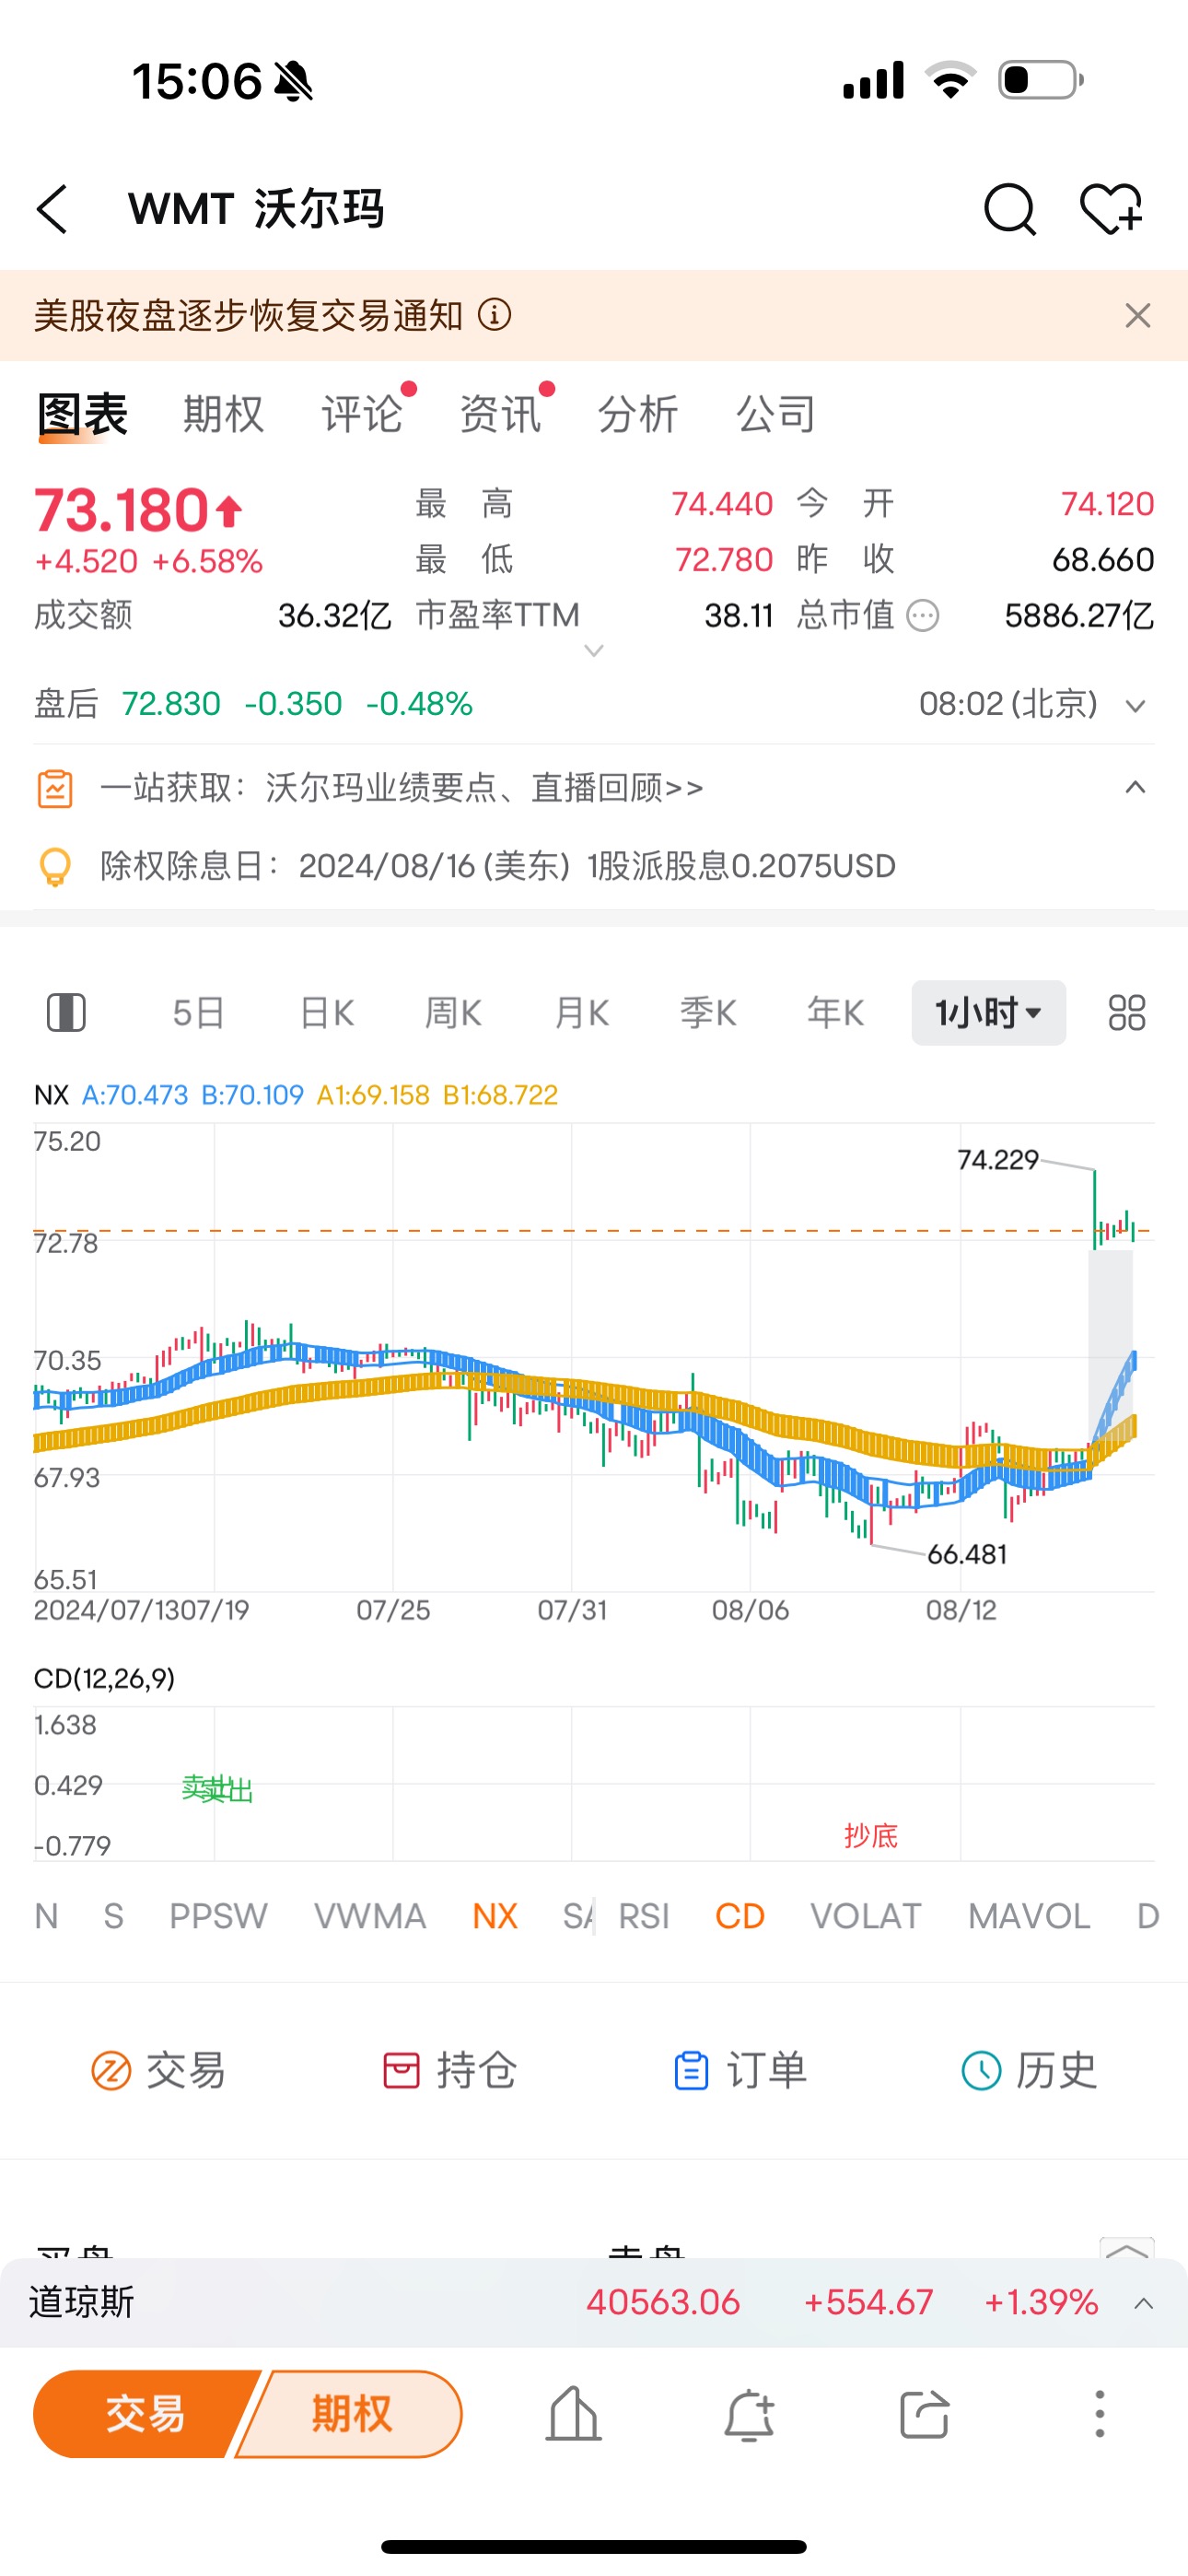
Interpretation of individual stock technical trends.
First, let's talk about Walmart.
Revenue of 169.34 billion US dollars, a year-on-year increase of 4.8%, which exceeds expectations. Based on this, there are CD indicators suggesting a bottom-fishing strategy in terms of technical trends.

(see the chart above)Buy low和sellis a CD indicator by default
Next, one is for holders, do not sell when the closing price of the candlestick chart does not break the lower edge of the blue ladder. The other is if you want to buy, wait for it to fall back to the lower edge of the blue ladder. I will provide more detailed explanation in the video tonight.

CRWD will continue to rise:


Tesla, as I mentioned to you on Monday, the hour-level bottom-fishing has already formed:

Do not sell until it breaks the lower edge of the blue ladder.
ASTS: Bottom-fishing indicated by the CD indicator on April 17th, do not sell when the closing price of the candlestick chart does not break the lower edge of the blue ladder

Never broken before:

Then just hold it until it breaks.
Disclaimer: Community is offered by Moomoo Technologies Inc. and is for educational purposes only.
Read more
Comment
Sign in to post a comment

CilaiWang : Can I buy a Tesla?