Interpretation of technical trends in US stocks
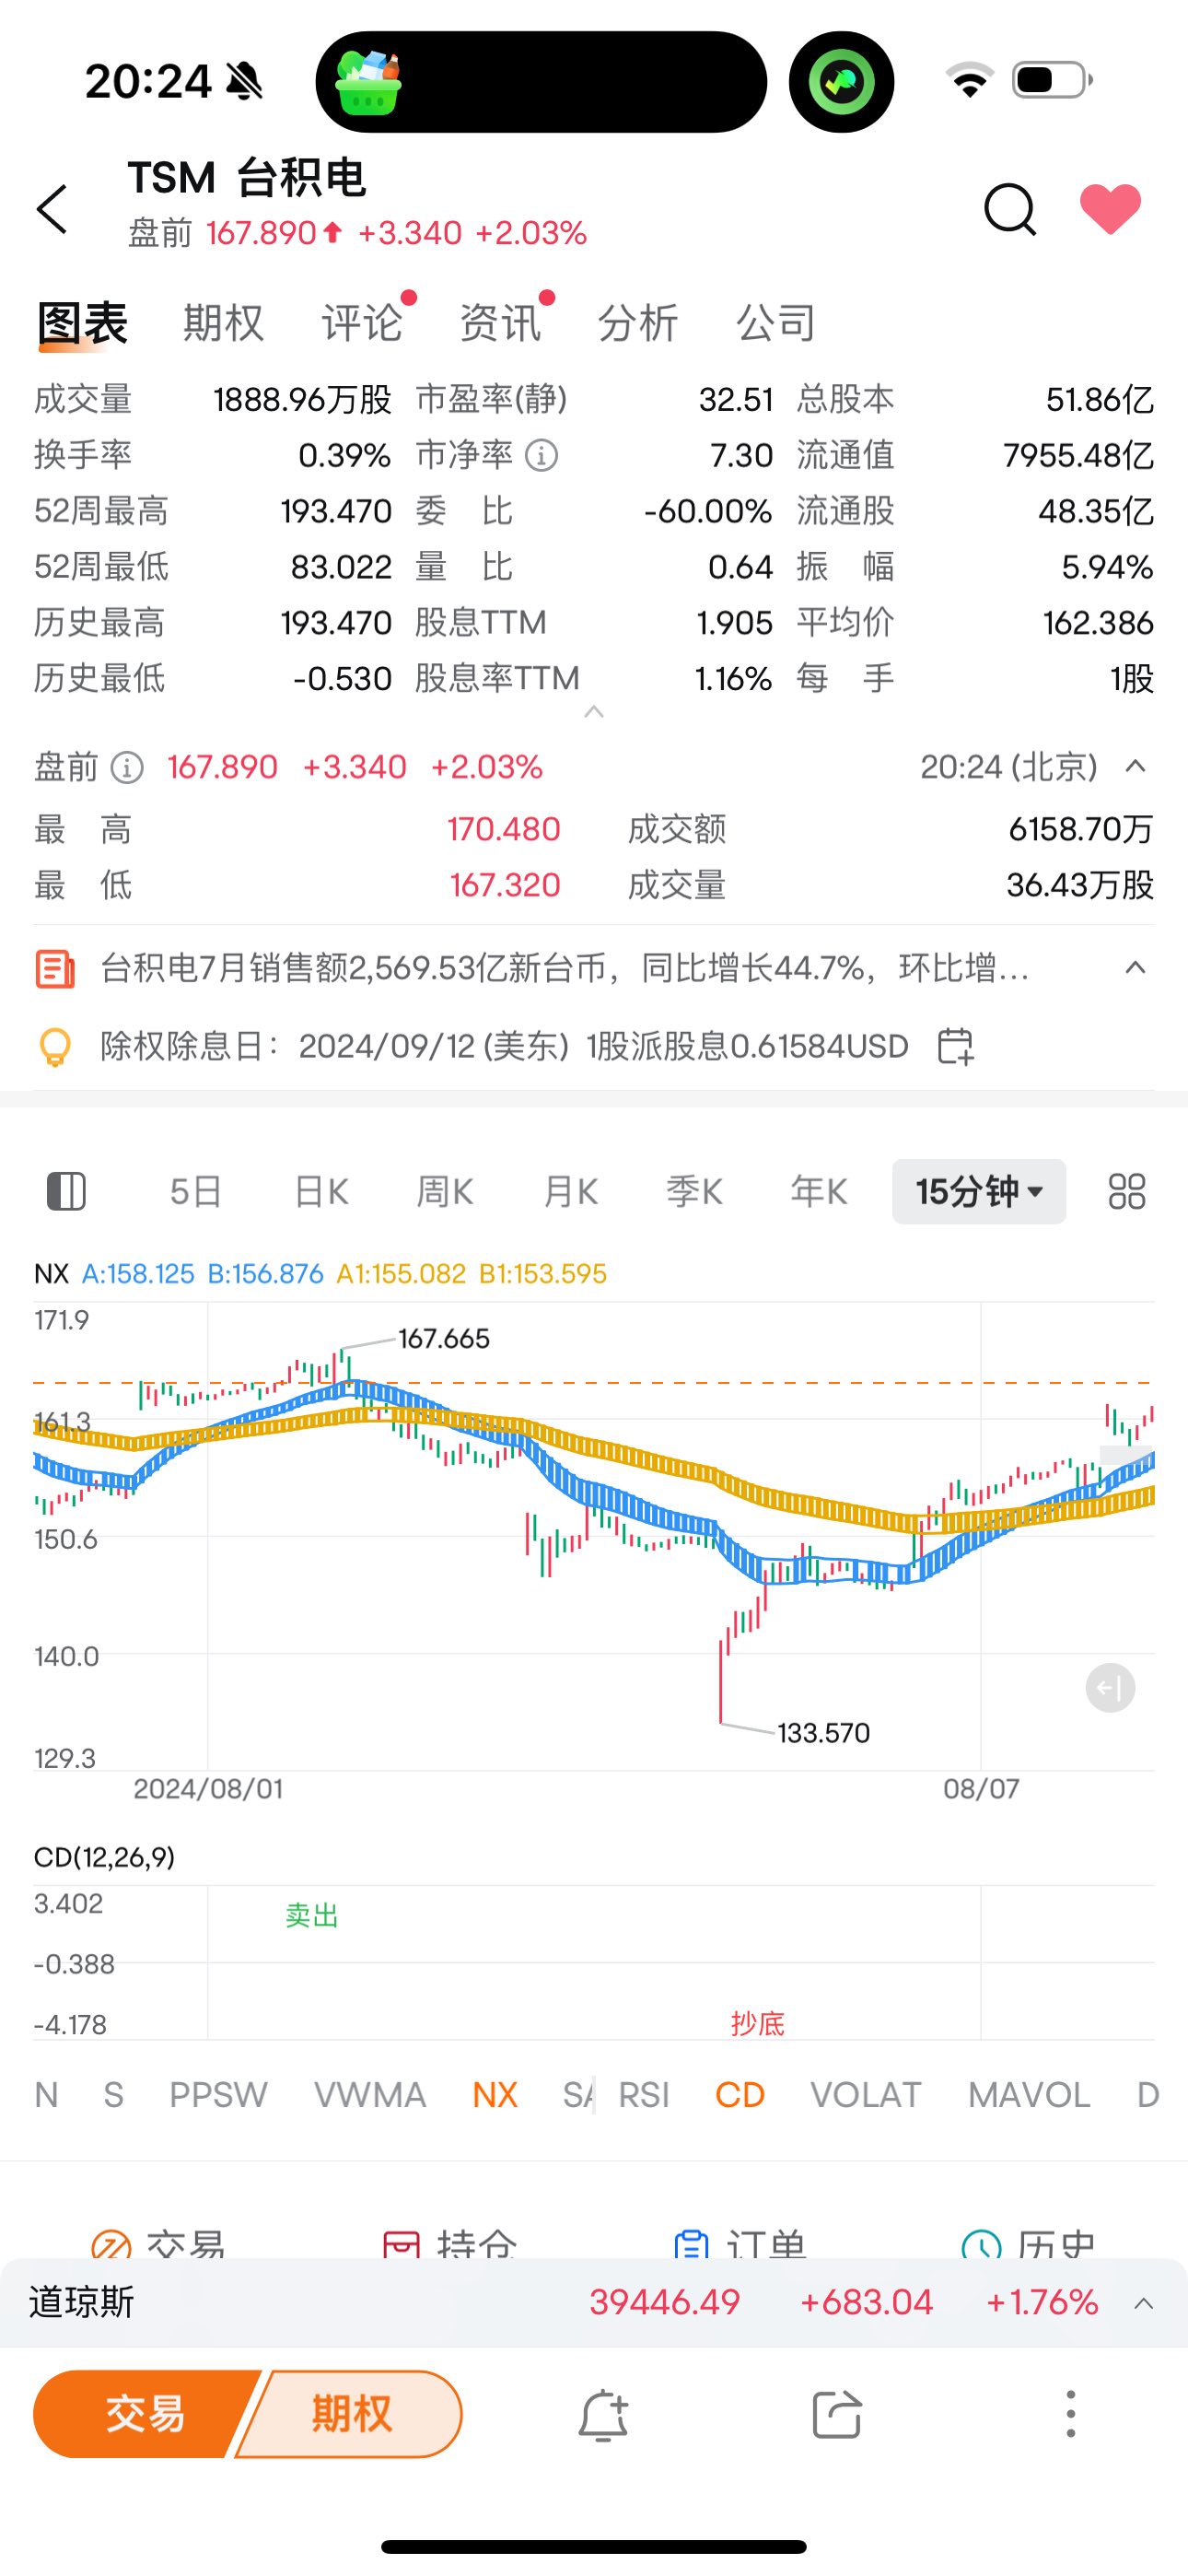
First, let's talk about TSMC
On July 31, the CD indicator showed sales, and on Monday, the CD indicator showed the bottom. I was bored to tell you in Monday's explanation video. Nvidia, TSMC, Ali, etc. are all undercut:

(The one pictured abovesellwithRead the bottom(It comes with the CD indicator)
And by Wednesday, we were reminded once again of TSMC's strength.
Fans who have received the “Cheats to Win in Stock Trading” I wrote should all know how our strong people play.
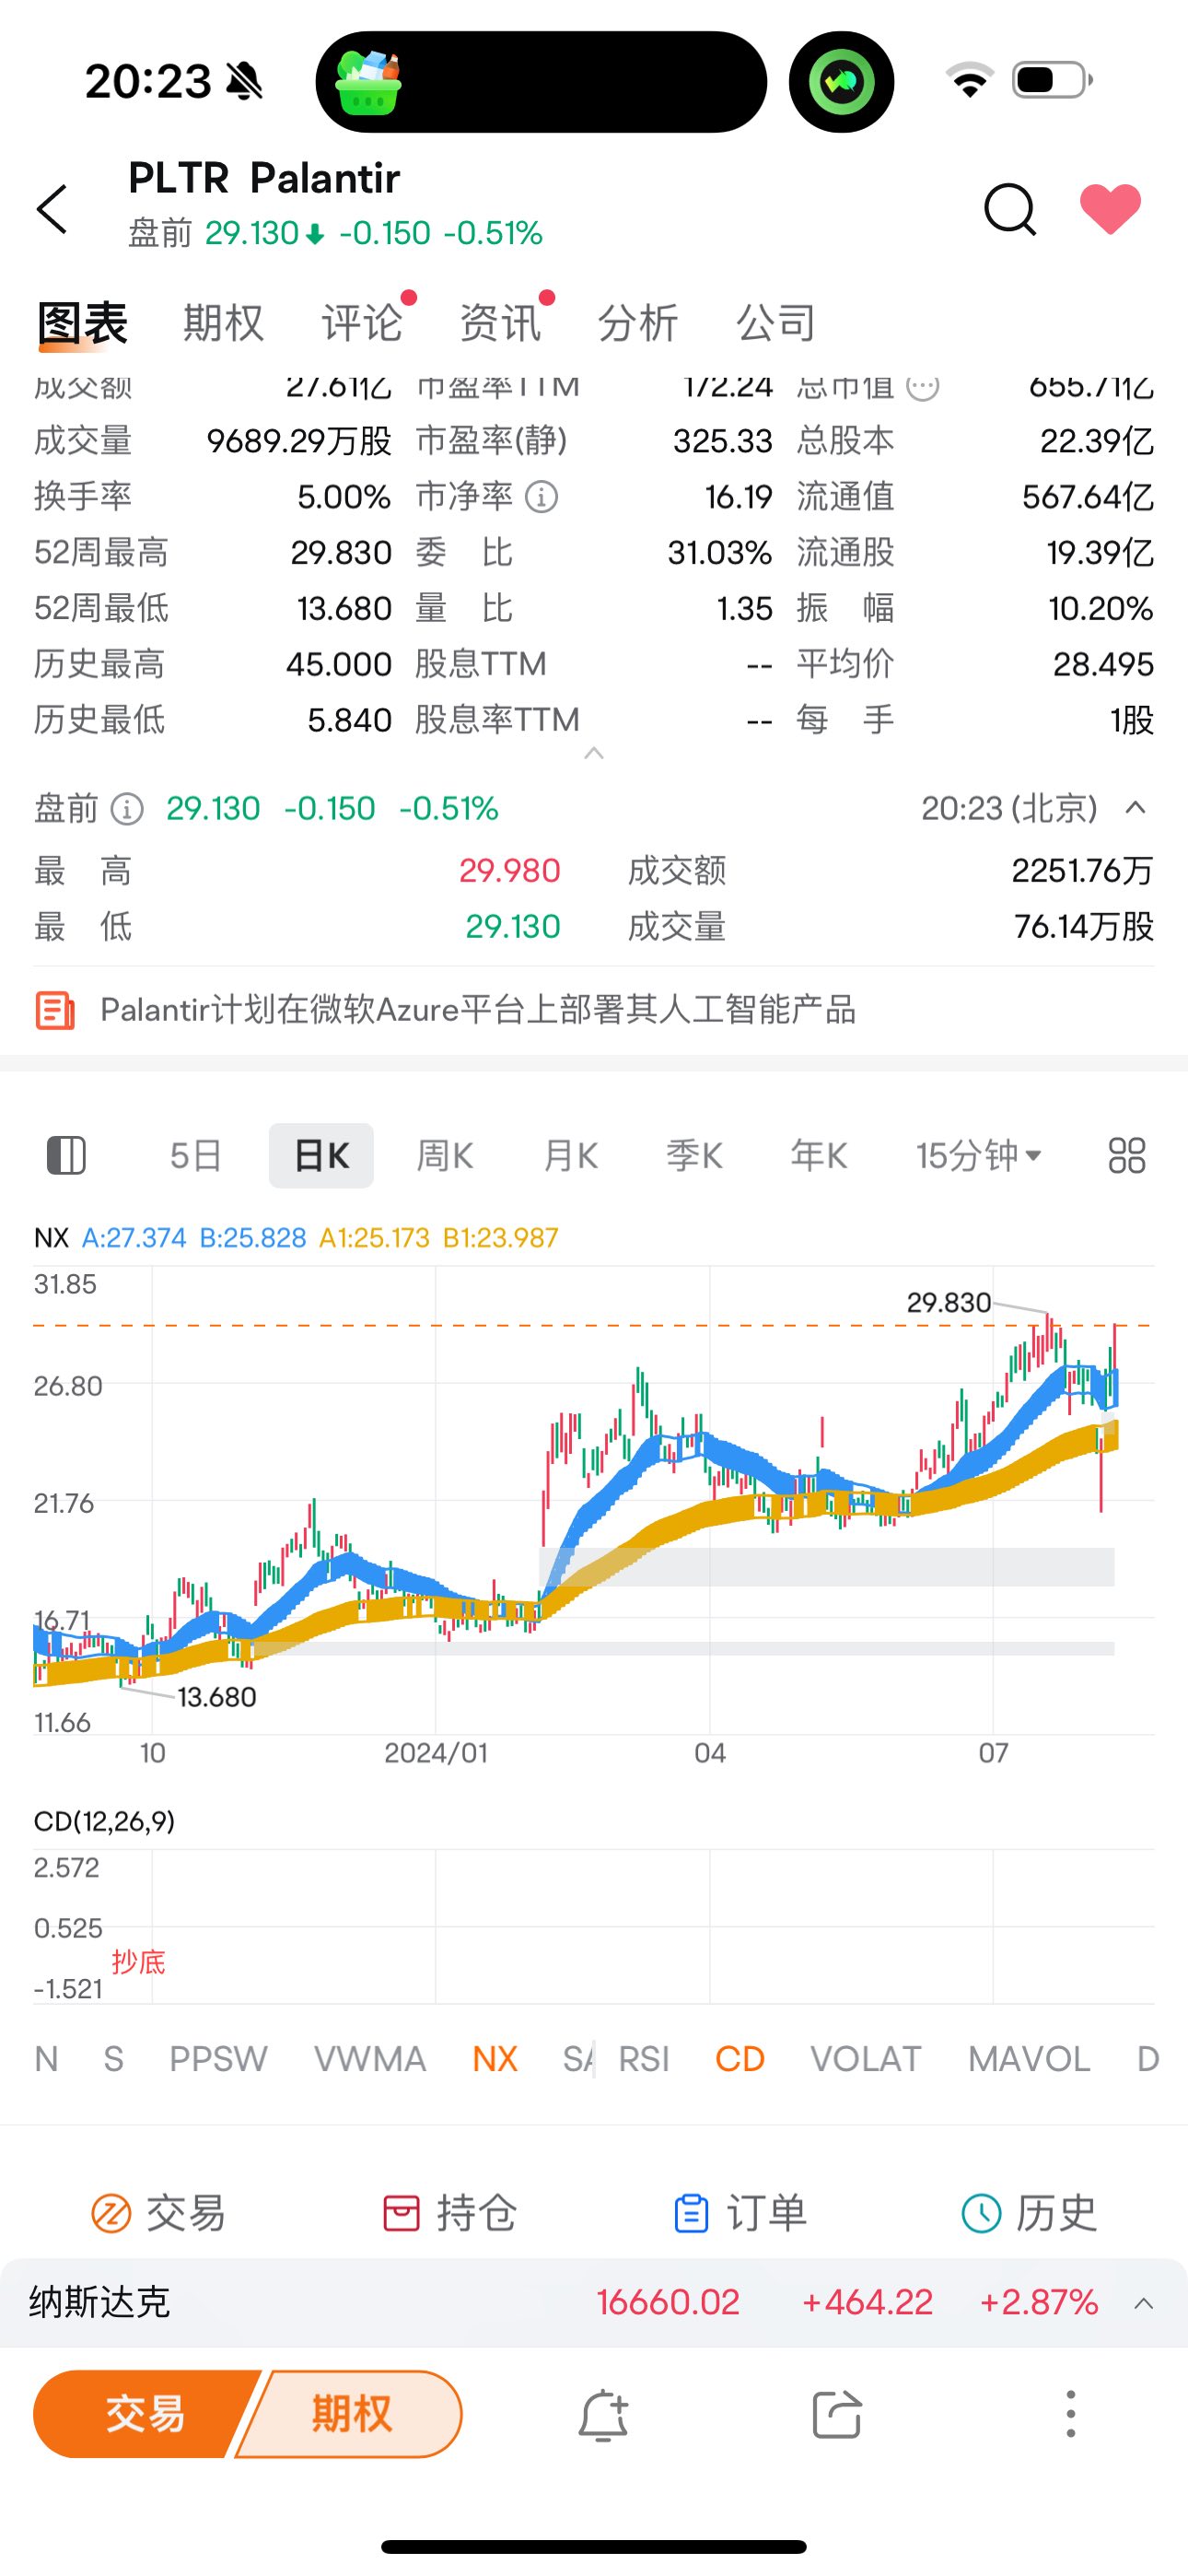
For example, PLTR, as I said, the strong are always strong, and there is a high probability that it will rise.
According to what I told you in my previous interpretation video, the Japanese level CD indicator suggests that after reading the bottom, the blue ladder is above the yellow ladder, and there is a high probability that it will rise. You must hold it all the time:

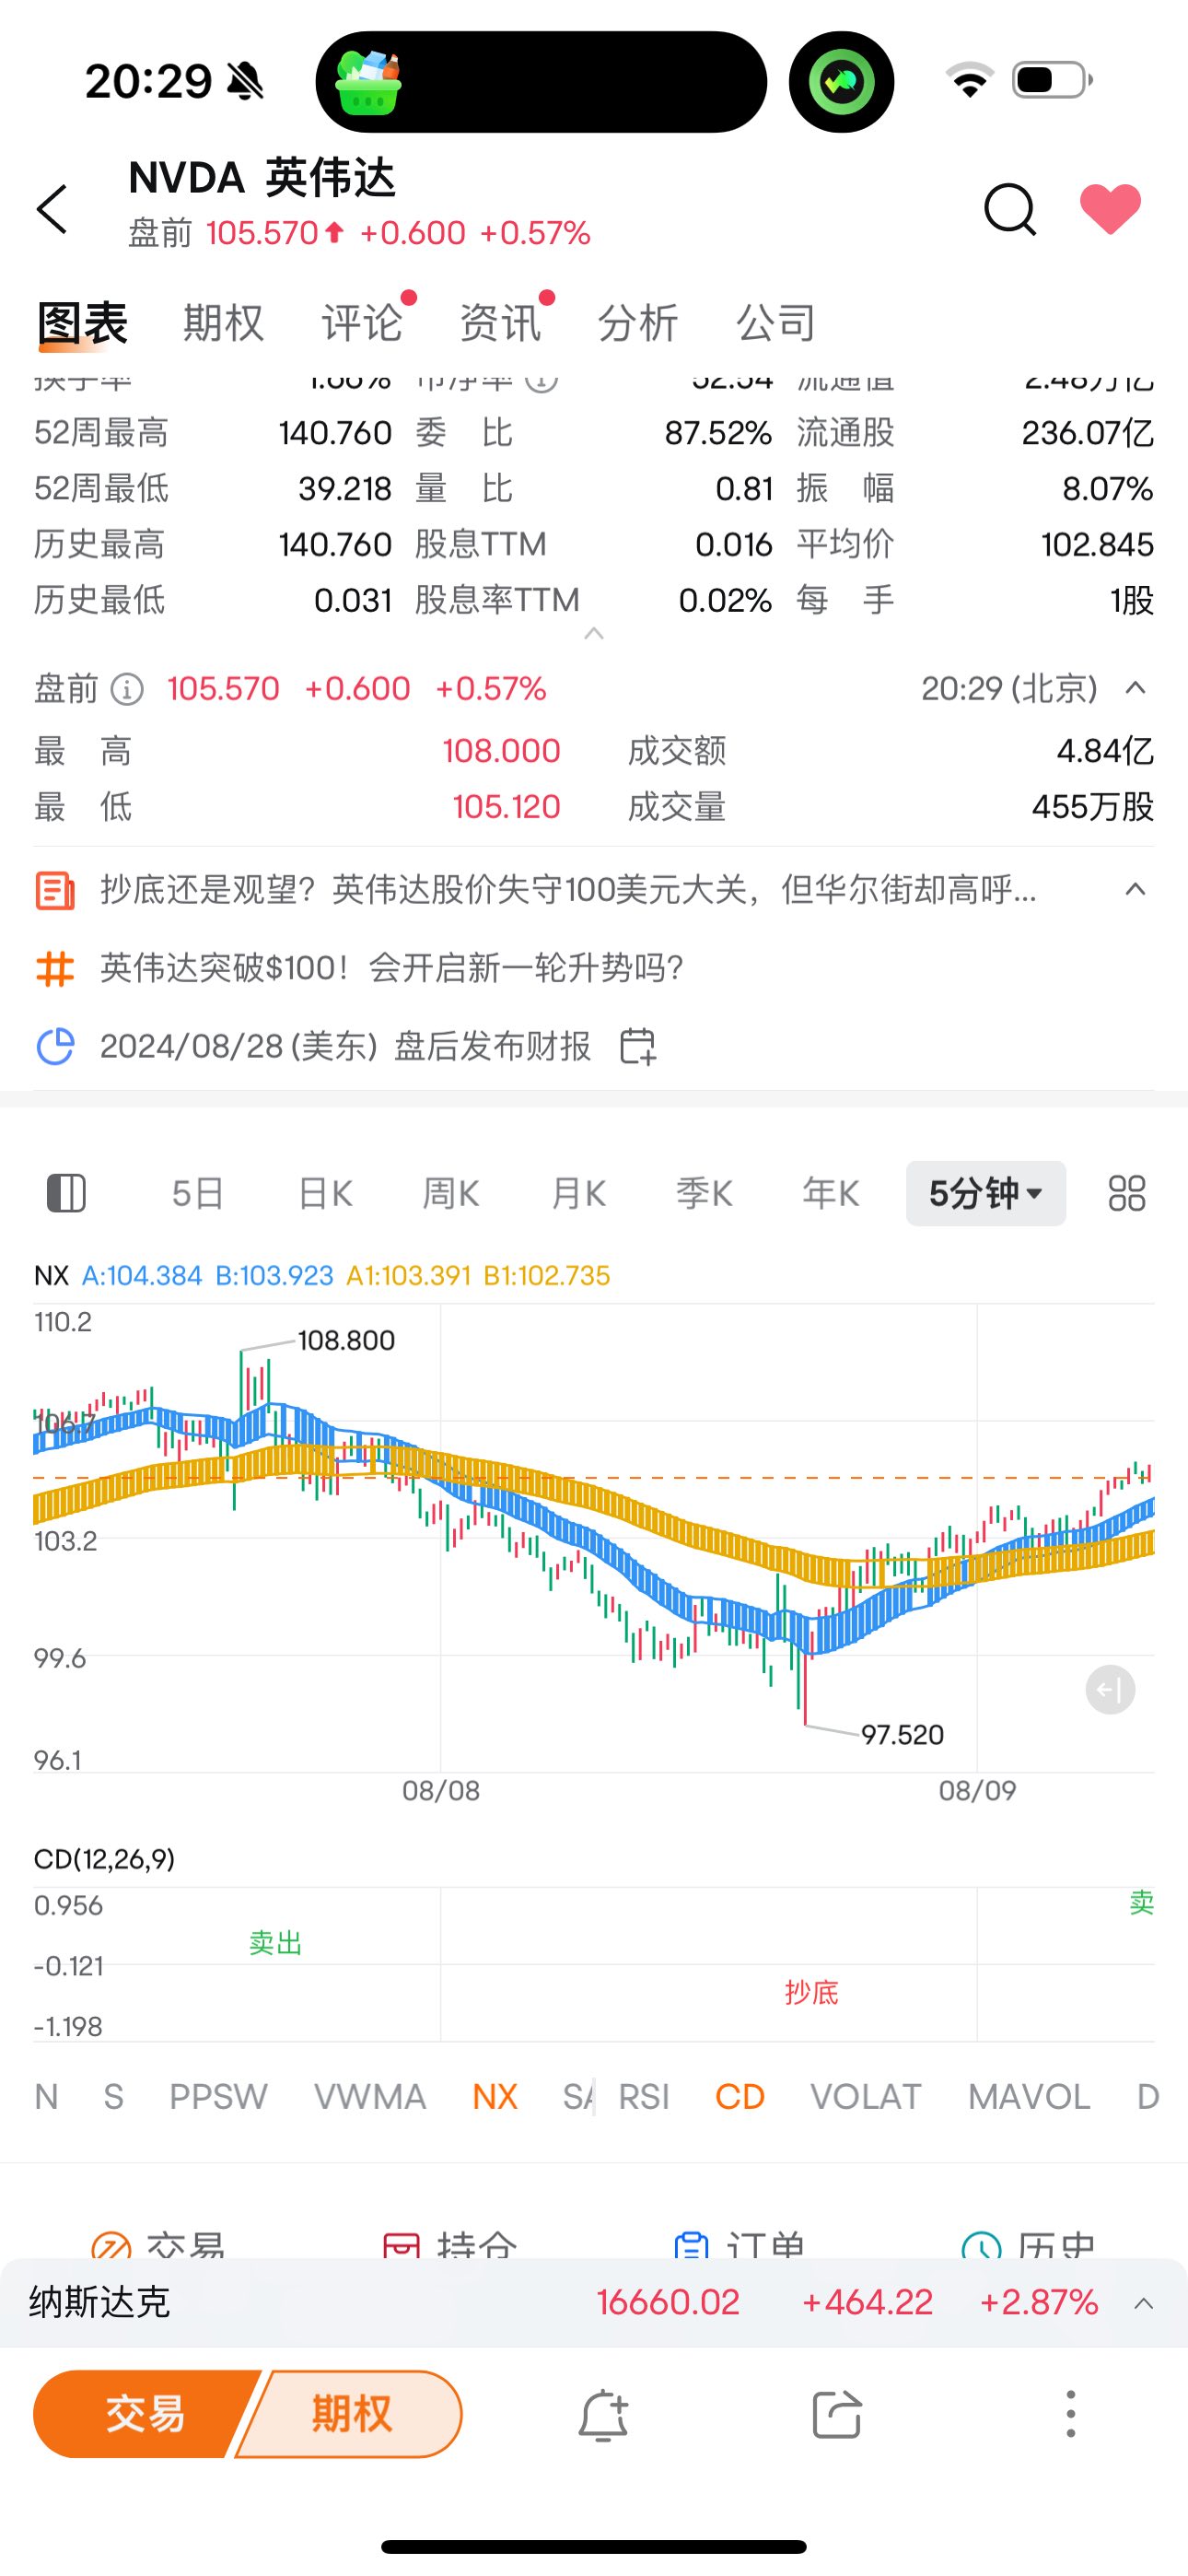
Nvidia, I gave you a very detailed explanation video last night. This stage is suitable for going back and forth:

Tesla, the big opportunity is here. Watch out. If the blue ladder turns upwards, we can buy back 250 sold positions:

Previously, we continue to hold Amway's RKLB. There is also U
I also forgot to remind you that today is Friday, the last day is right, guys
Disclaimer: Community is offered by Moomoo Technologies Inc. and is for educational purposes only.
Read more
Comment
Sign in to post a comment

英伟达冲破1000 : The blogger's WeChat account is clam