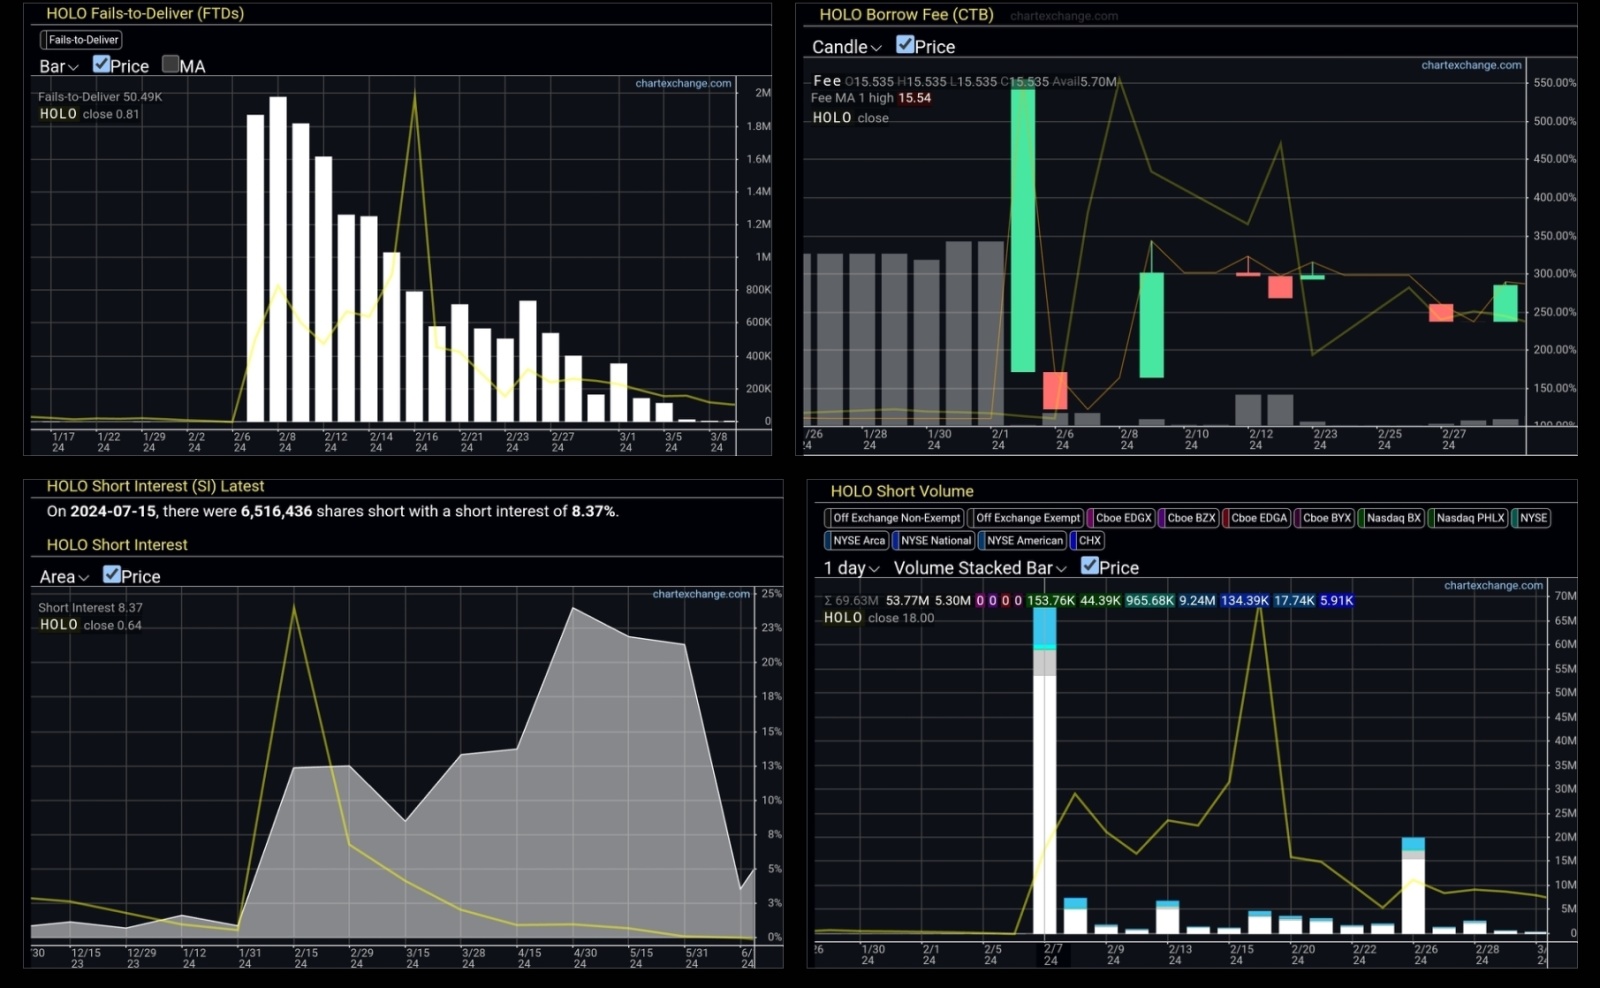
$MicroCloud Hologram (HOLO.US)$ compare the top 4 graphs and...


compare the top 4 graphs and see if you see a corelation between them, you will need to understand the mechanics and how each affects/ leads the other first.
2nd Pic is the Off Echange volume. If you open your chart and plot the days with offexchange volume in the mid to high 60s, even 70%, which is considered really high. One could argue that the increase in off Exchange volume precedes the pump, and in correlation with the graphs, you can draw your own conclusions. Now you could all agree that last week we had a fairly high off exchange volume, yes?
Disclaimer: Community is offered by Moomoo Technologies Inc. and is for educational purposes only.
Read more
Comment
Sign in to post a comment

DaScholar : I agreed but what is suppose to tell us about now? These charts are from early this year.
GoldmanStacks OP DaScholar : well, you're DaScholar. I gave you the answers in the second paragraph. Use the info I laid out and check the current graphs. it would be way too long for me to elaborate more and probably boring for most. You got this, I believe in ya.
Tonyco : He is saying high off exchange volume preceeds bumps in price. Late Jan early Feb preceeds Feb 7th +1k%, the later two preceeding a 100% bump.
It's pretty oversold atm, probably ready to take off soon
GoldmanStacks OP Tonyco : exactly, if you're rly interested, people have done many such case studies with GME, how Hedgefunds get around naked shorting, and abuses the T+35 and T+3, T+6 thats what the graphs show. I'm not trying to be rude by not elaborating, but it is about 60 pages of data.