Nasdaq Composite

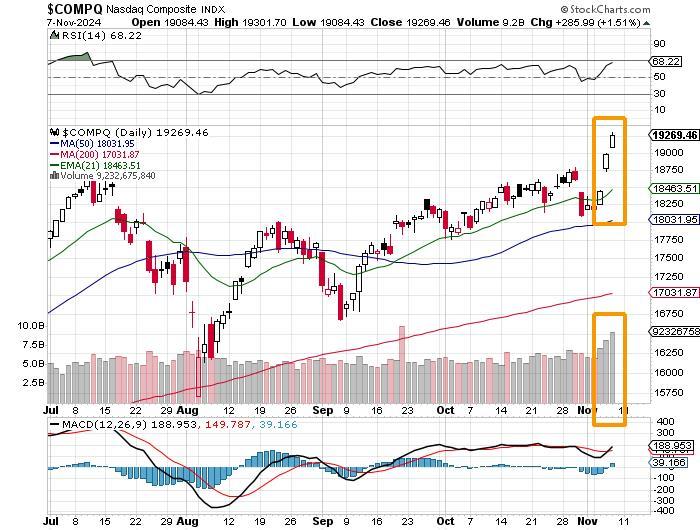
Take a look at this chart of the Nasdaq Composite. Though we have just seen a three day run for the stars on trading volume that continues to grow, the reading for Relative Strength is yet to hit the 70 level. That's above the chart. Below the chart, the daily MACD is finally postured more bullishly than it has been. The histogram for the 9-day EMA has at last moved back above zero, while the 12-da EMA (black line) has crossed over the 26-day EMA (red line).
Pausing to rest would probably be healthy for this equity market as markets do need to consolidate recent gains. That said, these indicators do not tell the tale of a market that's going to want to rest for a very long time. We still need to see a break between a day one reversal and technical confirmation.
Disclaimer: Community is offered by Moomoo Technologies Inc. and is for educational purposes only.
Read more
Comment
Sign in to post a comment
