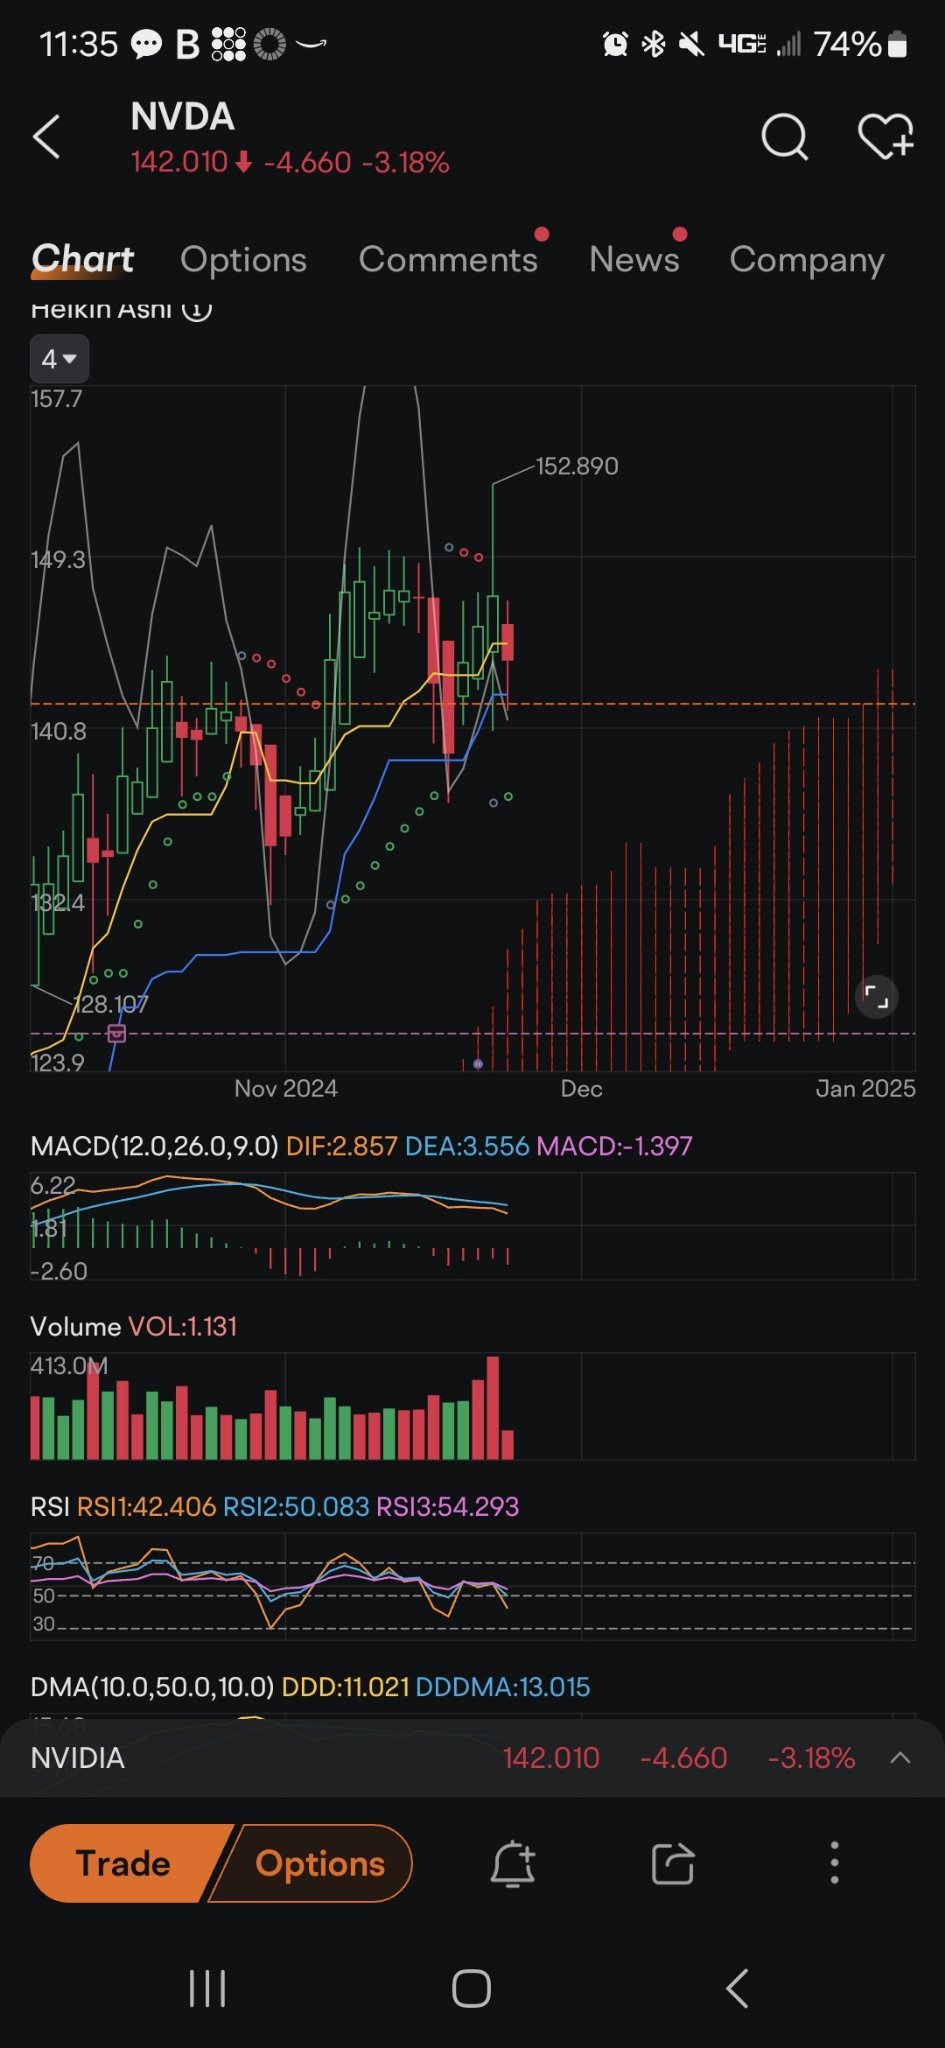
$NVIDIA (NVDA.US)$ daily chart. check price line on bottom o...
daily chart. check price line on bottom of wick this is a new candle forming towards a consecutive green. the green dots under are bullish. it's not "crashing" its filling. patience.


Disclaimer: Community is offered by Moomoo Technologies Inc. and is for educational purposes only.
Read more
Comment
Sign in to post a comment

一个来自马来的韭菜 : There is a high probability of going up, 152 is just the first attempt, hoping to stand firm next time at 152 and then go up.
Ultratech OP 一个来自马来的韭菜 : its at the bottom of a wick