Account Info
Log Out
English
Back
Log in to access Online Inquiry
Back to the Top
With AMD's stock declining from poor Q4 guidance, do you think INTC will do better?
Views 1M Contents 158

$NVIDIA (NVDA.US)$ daily chart looks high a little shitty bu...

daily chart looks high a little shitty but the weekly 1sr chart still needs a consecutive 7 8 and 9.  the monthly 2nd chart 144.420 blocked the red dots nicely you see that grey dot under price is a new line of greens starting. the price needs to fall infront of the green dots that will start forming probably around 120 or at moment 90 to break long uptrend. 3rd chart daily the red dots more bearish the price needs to rise enough to block the only good news there is they're moving sideways.  4th chart 4hr the 9s down are completing once done and red dots hit a reversal sends it into green pond ahead. this is all speculation and id expect volatility before election
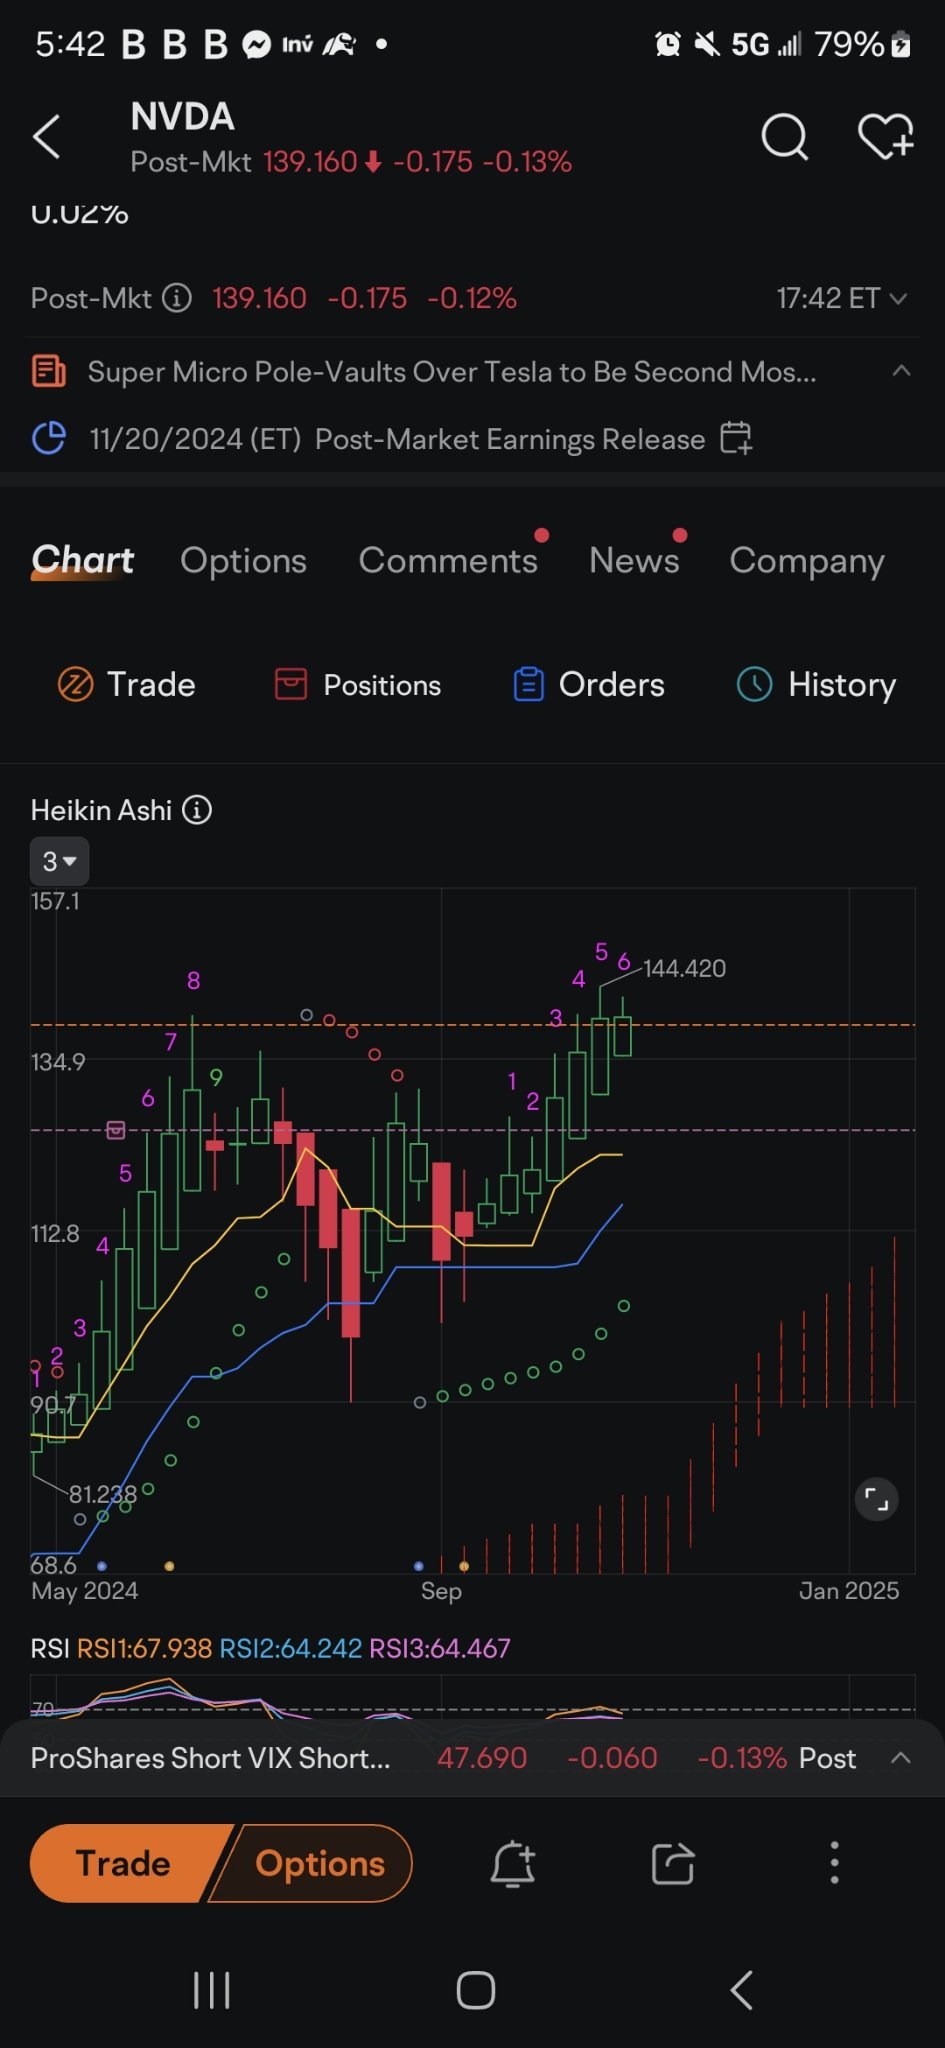
$NVIDIA (NVDA.US)$ daily chart looks high a little shitty but the weekly 1sr chart still needs a consecutive 7 8 and 9.  the monthly 2nd chart 144.420 blocked t...
Disclaimer: Community is offered by Moomoo Technologies Inc. and is for educational purposes only. Read more
9
+0
Translate
Report
35K Views
Comment
Sign in to post a comment
    I don't like you.
    958Followers
    86Following
    8246Visitors
    Follow