Account Info
Log Out
English
Back
Log in to access Online Inquiry
Back to the Top
Sharpen your trading skills with Moomoo Paper Trading!
Views 1.1M Contents 4771

ok guys my technical analysis is if I see a green candle 3/4...

ok guys my technical analysis is if I see a green candle 3/4 consuming a red candle above it's open in the 5 or 10 min chart. then I'm all in. taking 25% or better. the goal is using the daily compound strategy. day 1 $1000×25%=1250 option 25% or better. day 2 sell option for profit. buy a runner $1250×25%=1562. day 3 $1562×25%=1953. day 25 $211,722×25%=264,653
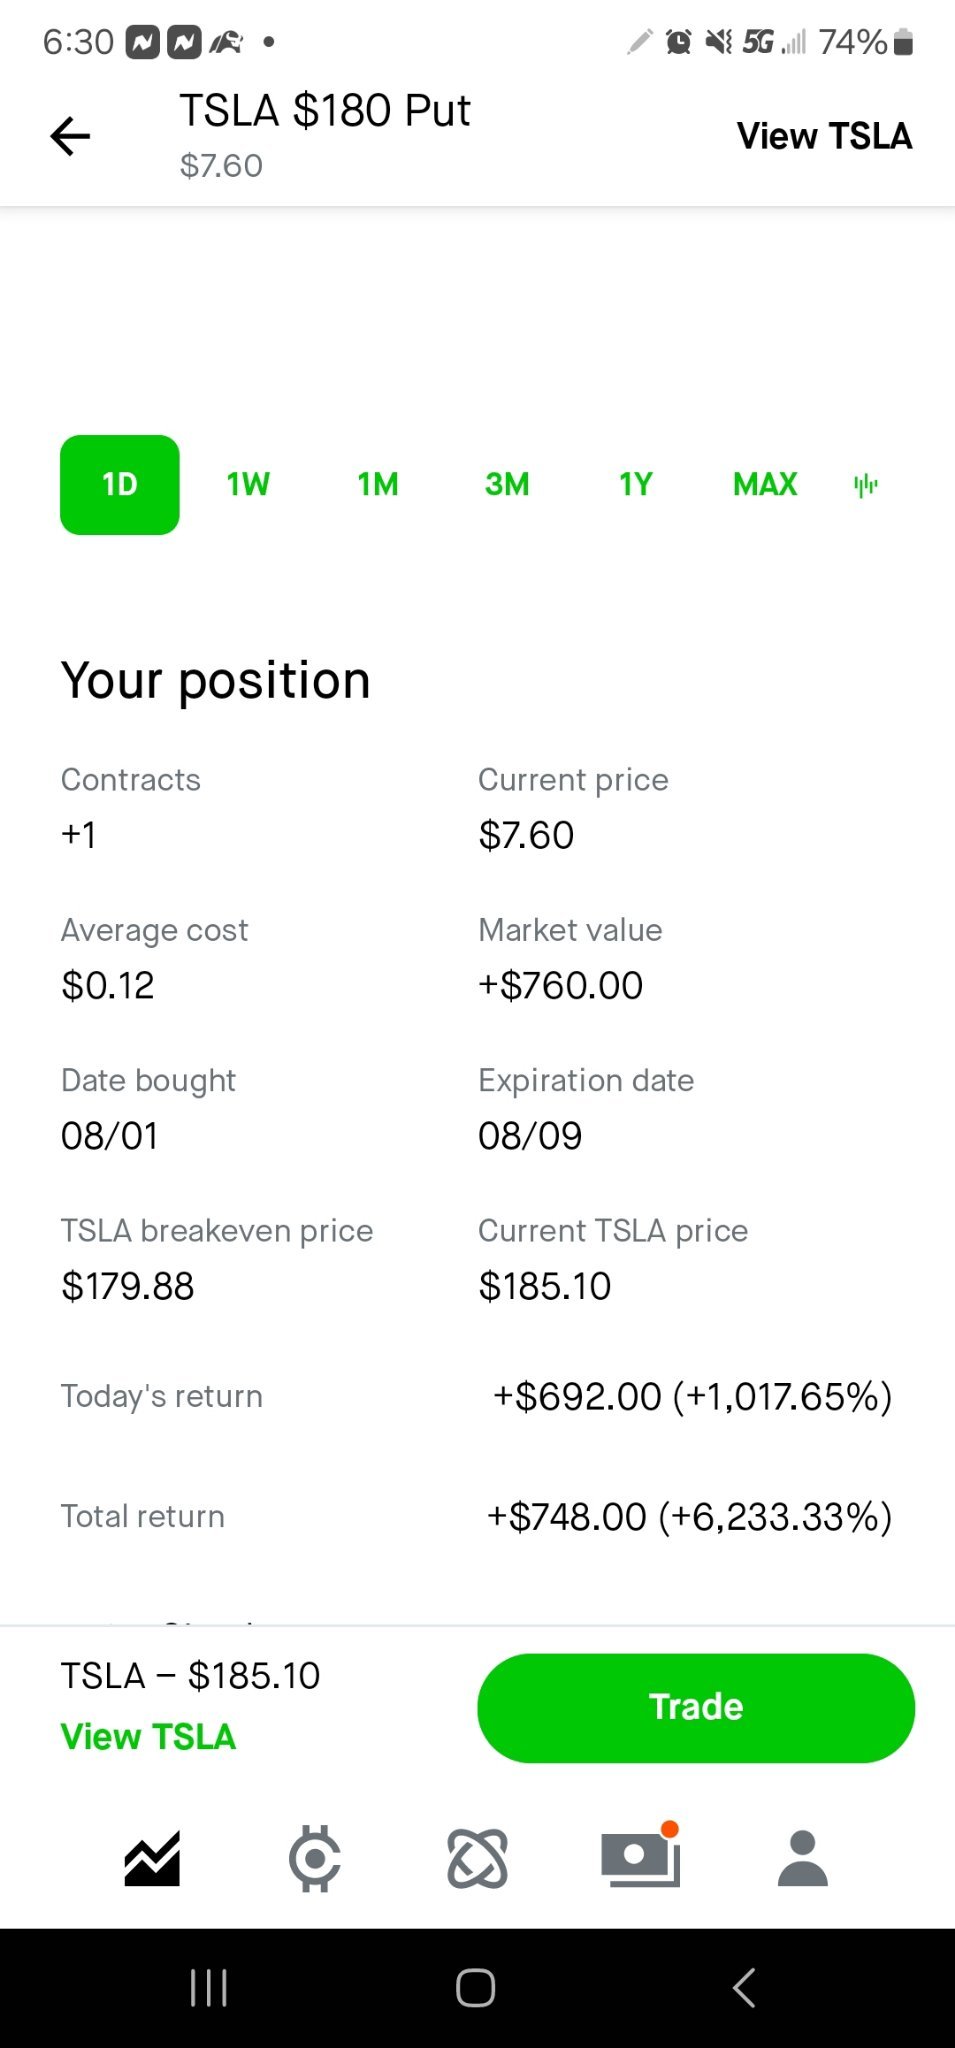
ok guys my technical analysis is if I see a green candle 3/4 consuming a red candle above it's open in the 5 or 10 min chart. then I'm all in. taking 25% or bet...
the put option was due to the economy in Japan wen they released the news of the recession
Disclaimer: Community is offered by Moomoo Technologies Inc. and is for educational purposes only. Read more
4
+0
Translate
Report
50K Views
Comment
Sign in to post a comment