$QQQ
1. Price Movement:
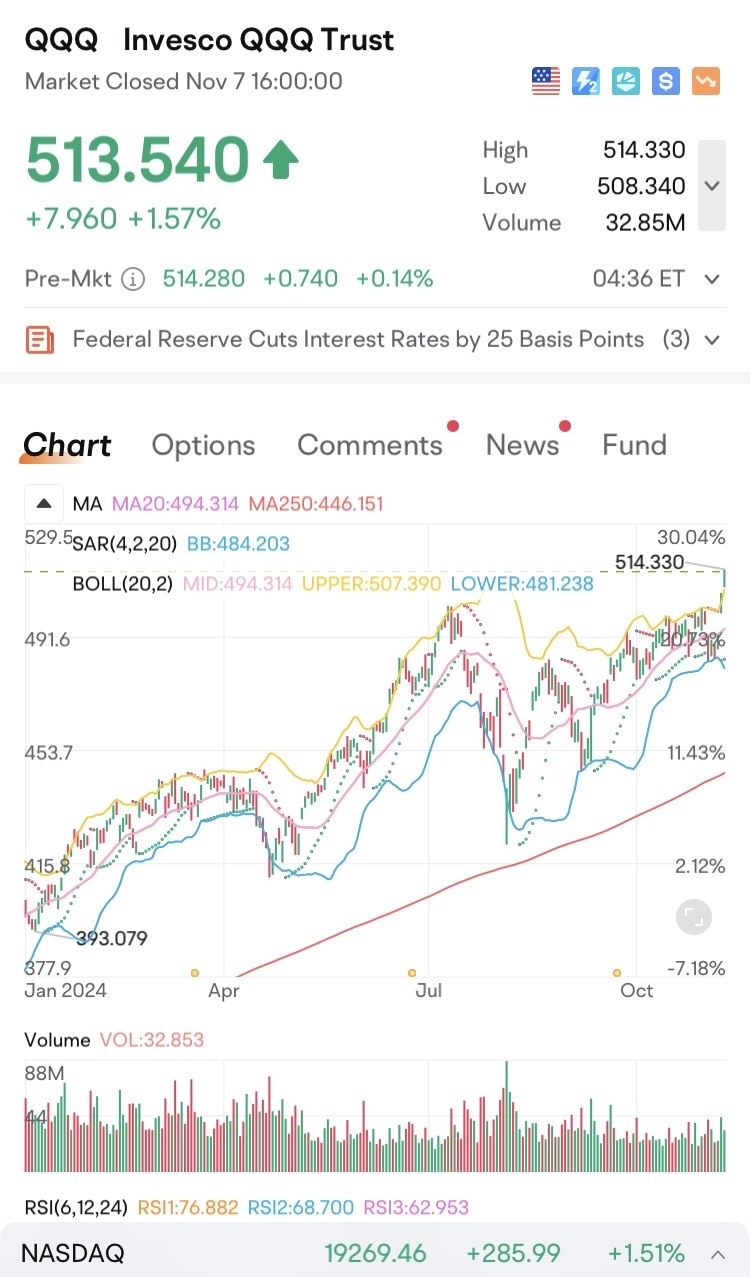
• The closing price of $513.54 reflects a gain of 1.57%, suggesting strong upward momentum on this trading day. The pre-market price is slightly higher, indicating continued optimism in the early trading hours.
• A high of $514.33 and a low of $508.34 during the day shows a relatively narrow trading range, which may indicate consolidation after recent gains.
2. Volume:
• With 32.85 million shares traded, volume appears to be significant, showing active interest from traders. High volume on an up day generally signals strength behind the price movement, which could attract more buyers.
3. Technical Indicators:
• Moving Averages:
• The 20-day moving average (MA20) is at $494.31, and the 250-day moving average (MA250) is at $446.15. Since the price is well above both moving averages, this is a strong bullish signal, suggesting that the QQQ is in an uptrend over both the short and long term.
• Bollinger Bands:
• The price is near the upper Bollinger Band of $507.39, often indicating that the stock is nearing overbought territory. However, in strong uptrends, prices can “ride” the upper band, suggesting continued strength rather than an immediate reversal.
• Parabolic SAR:
• The Parabolic SAR (Stop and Reverse) level at $484.20 is below the current price, supporting a bullish outlook. The SAR indicator is often used as a trailing stop level in uptrends, so as long as the price remains above this level, the trend is considered intact.
• Relative Strength Index (RSI):
• The RSIs of 76.88, 68.70, and 62.95 indicate that the price is in overbought territory (typically above 70), particularly the first value. This could mean that a pullback or period of consolidation might be on the horizon, but it also shows strong buying momentum.
4. Market Sentiment:
• The alert about the Federal Reserve cutting interest rates by 25 basis points is significant. Rate cuts generally lower borrowing costs, which is positive for equity markets as it can lead to more economic activity and spending. This action may be part of the reason for QQQ’s recent strength, as lower rates often fuel growth in tech stocks, which make up a large portion of the QQQ.
5. NASDAQ Index:
• The broader NASDAQ index, closing at 19,269.46 and up 1.51%, mirrors the bullish trend seen in the QQQ. Given that QQQ tracks the Nasdaq-100, strength in the index confirms that this movement is market-wide rather than isolated to QQQ.
Overall Interpretation
This data points to a strong bullish trend for QQQ, supported by high volume, upward momentum, and favorable market conditions due to rate cuts. However, the RSI suggests the possibility of short-term overbought conditions, which may lead to a slight pullback or consolidation before potentially resuming the uptrend.
Suggested Actions
• For Current Holders: This may be a good time to continue holding, but consider setting a trailing stop or taking partial profits to lock in gains in case of a pullback.
• For New Buyers: Given the high RSI, it may be prudent to wait for a pullback or consolidation before entering. Alternatively, you could enter a small position with plans to add more on a dip.
• For Traders: Monitor the upper Bollinger Band for any signs of reversal or breakout, and use the Parabolic SAR level as a potential stop-loss in case the trend weakens.

Disclaimer: Community is offered by Moomoo Technologies Inc. and is for educational purposes only.
Read more
Comment
Sign in to post a comment
