TSLA
Tesla
-- 453.866 NVDA
NVIDIA
-- 140.180 RGTI
Rigetti Computing
-- 14.4000 LAES
SEALSQ Corp
-- 8.930 PLTR
Palantir
-- 81.950 Don’t forget to like the content you enjoy. Good contributions deserve more support and encourage authors to share even more in the future!
Disclaimer: This presentation discusses technical analysis, other approaches, including fundamental analysis, may offer very different views. The examples provided are for illustrative purposes only and are not intended to be reflective of the results you can expect to achieve. Specific security charts used are for illustrative purposes only and are not a recommendation, offer to sell, or a solicitation of an offer to buy any security.

Chart Talks is a series of posts dedicated to technical analysis, with each post focusing on individual stocks that have garnered significant interest from mooers.

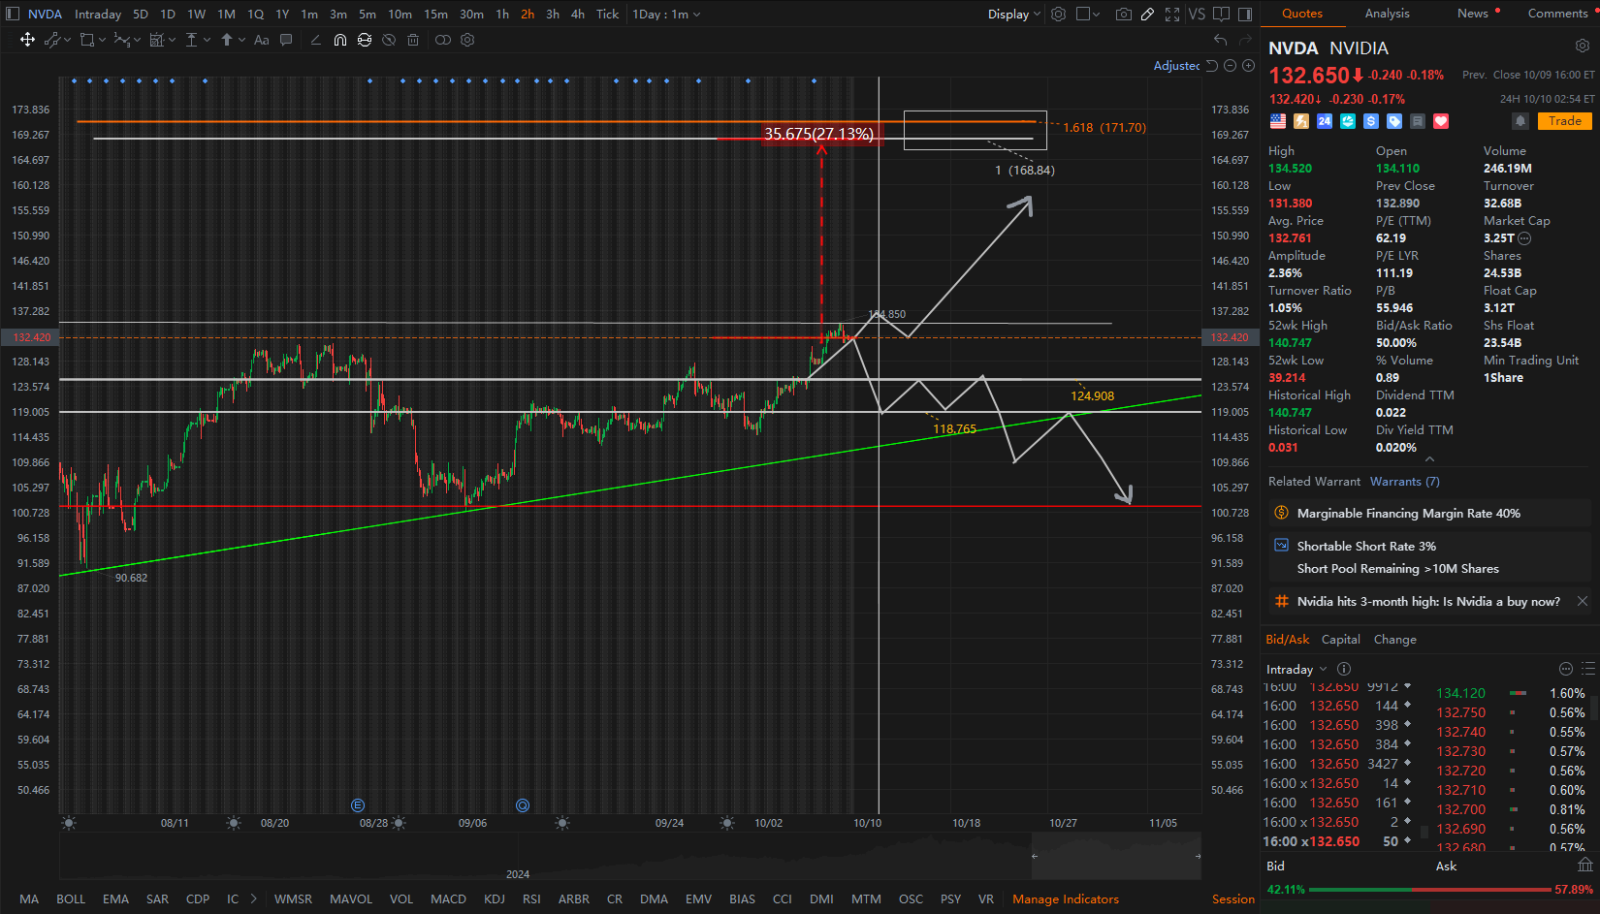
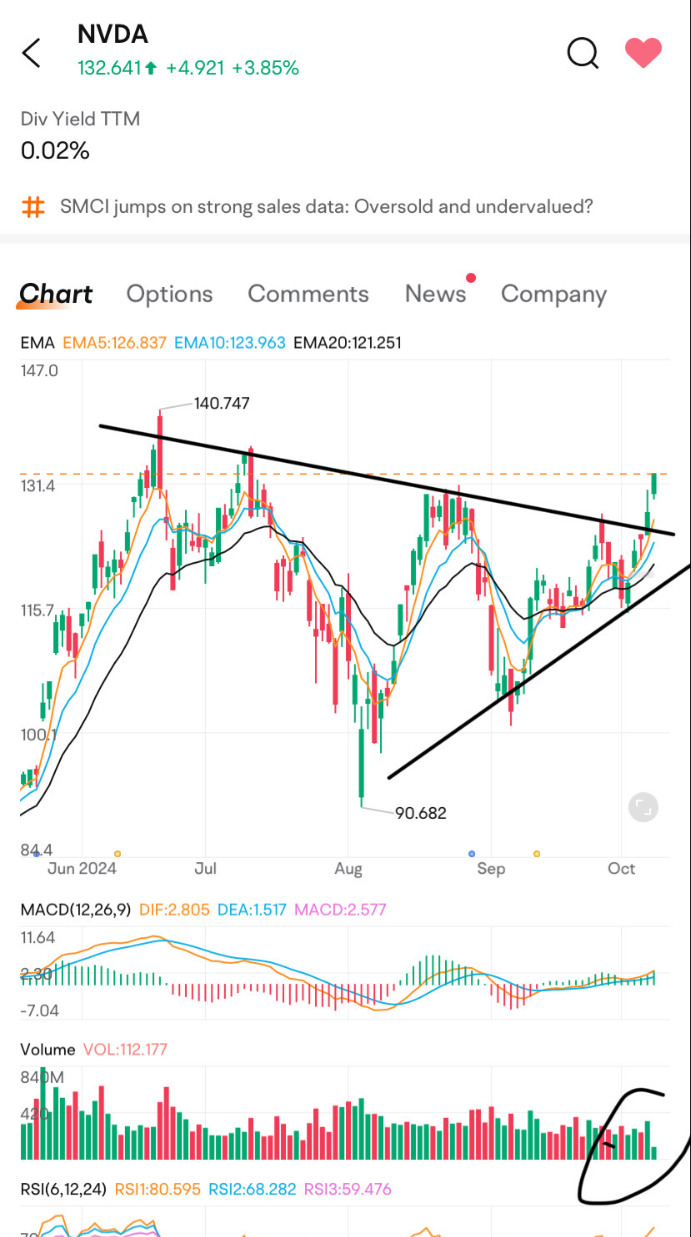
Meta Moo OP : Let’s Discuss: use technical analysis and charts to share your perspective on Nvidia’s future trends. The top three on-topic comments with technical charts pic will be given 188 points for each!
CasualInvestor :
BeautyWolf : I'm done with the negativity—my gains will do all the chatting! First target: 150, while the naysayers expect a sell-off. A brief pullback to 129 is a chance to position for the rise to 150. Don't swim against the current—it's been going up, up, up!
  Stocks usually chill out only after hitting their goals, and any recession is just a short-lived hiccup.
  Get this, and you'll be rocking those long-term trades like a pro. $NVIDIA (NVDA.US)$ $GraniteShares 2x Long NVDA Daily ETF (NVDL.US)$ $T-Rex 2X Long Nvidia Daily Target ETF (NVDX.US)$
TiA Wong : Before election, market won’t crush. Simple and straightforward. If nvdia really plan to crush , then it will side way until after election. However , optimistic about nvdia market value over Apple , it happens With purpose retailer chase high . Since it over Apple market value, worldwide will report the new to caught retailer attention
Ultratech BeautyWolf : media saying soft landing likely that's what powell been working towards so we don't have a recession. People should learn to respect powell not think hes out to tank market but he's doing his job well and has been fixing things slowly so we are in a recovery growth
151776182 : As long as Blachwell really goes public, it will definitely soar, it has just crossed the shin line.
CNNT : With my limited TA skills, I picked up 3 downward price reversal signals.
1) Bearish divergence occurred with lower trading volumes
2) Price sitting at the upper half of the support and resistant trendlines, while an upward breakout is possible, it's also a signal for 'overbought' and a possible correction
3) Price touched the upper bollinger band, signalling a reversal
Happy to be corrected if any of these observations are weak.
74635626 : 150
Alan Tan 俊帆 :
The Nut : hll
p
i nedd to pay for my bar chor mee
View more comments...