$RGTI
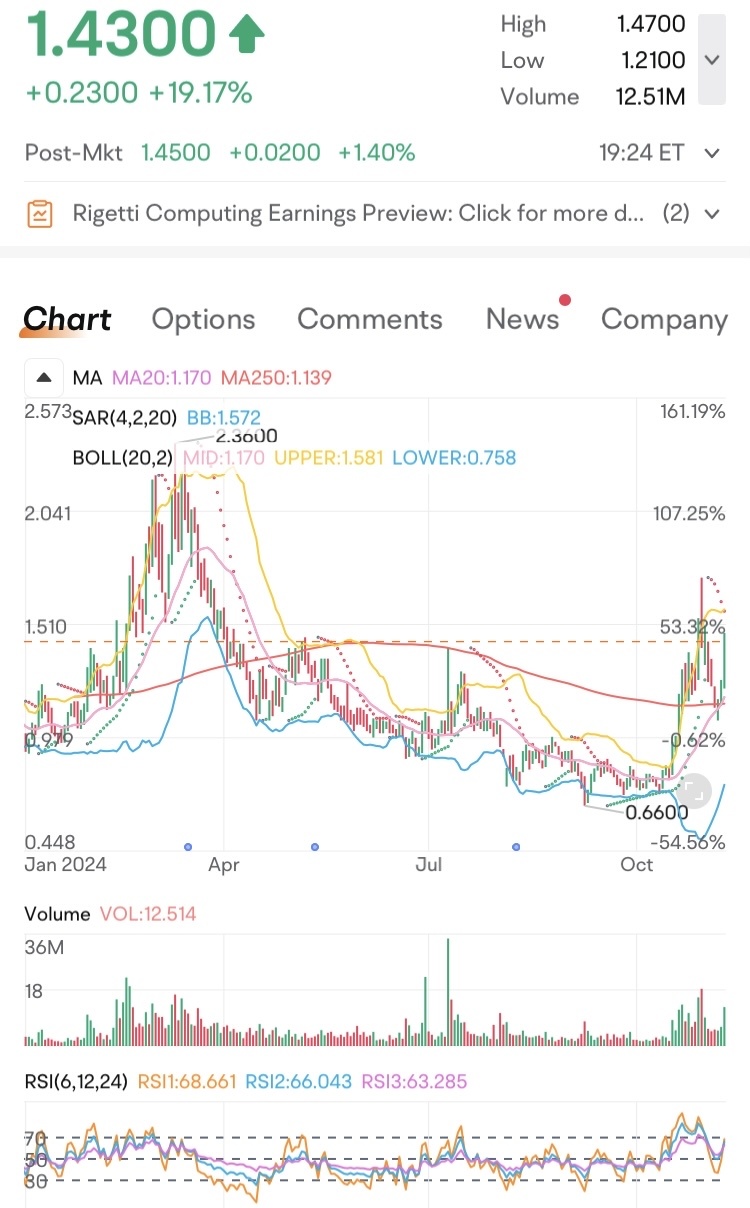
$RGTI another quantum name to watch...
Trying to break a two-year downtrend.
Heavy accumulation. And red hot theme! 🔥
Trying to break a two-year downtrend.
Heavy accumulation. And red hot theme! 🔥

1. Moving Averages (MA): The 20-day moving average (MA20) is at 1.17, and the 250-day moving average (MA250) is at 1.139. The price is currently above both moving averages, which might indicate a short-term upward trend.
2. Bollinger Bands: The chart includes Bollinger Bands set at 20 periods with a standard deviation of 2. The current price is close to the upper band (1.581), suggesting it is in the overbought territory, potentially indicating resistance or a pullback.
3. Relative Strength Index (RSI): The RSI values (6, 12, and 24 periods) are 68.66, 66.04, and 63.29, respectively. The RSI levels near 70 suggest that the stock is approaching overbought territory, which could indicate a potential reversal or the need for caution.
4. Parabolic SAR: The SAR indicator suggests a recent shift in trend direction with dots below the price, indicating a bullish sentiment.
5. Volume: The volume shows increased activity, with 12.51 million shares traded. High volume, especially on an upward price movement, can signify strong buying interest.
Overall, the stock has shown a substantial recent gain, and technical indicators hint that it is nearing overbought levels, which might lead to a period of consolidation or correction. This would be a good time to monitor closely for any trend reversals, especially if you’re considering a short-term trade.
Disclaimer: Community is offered by Moomoo Technologies Inc. and is for educational purposes only.
Read more
Comment
Sign in to post a comment

mehdi zinati : Hello teacher, can you send me the settings of the indicator for MetaTrader 4 mobile Android