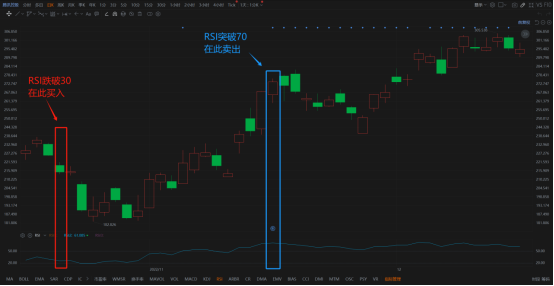
Today, as usual, we’ll focus on a single indicator. I’ve noticed that many of my followers have a basic understanding of trading, so diving straight into complex topics may be overwhelming. Today, we’ll discuss another important indicator: RSI (Relative Strength Index). RSI is a commonly used technical analysis tool that measures whether a market is overbought or oversold. It helps traders assess if the market is overheated or too cold, enabling them to make informed buy or sell decisions.
RSI Value Range:
RSI ranges between 0 and 100.
Above 70: The market might be overbought, signaling a potential price correction or downturn.
Below 30: The market might be oversold, signaling a potential rebound or upturn.
Key Concepts:
Overbought (RSI > 70):
When RSI exceeds 70, it indicates that the market may have risen excessively and could be at risk of a price correction. Traders might consider selling or staying on the sidelines.
Oversold (RSI < 30):
When RSI falls below 30, it indicates that the market may have dropped excessively and could be poised for a rebound. Traders might consider buying or staying on the sidelines.
Divergence Between Price and RSI:
When the price makes a new high but RSI fails to do so, or when the price makes a new low but RSI doesn’t follow suit, this is called divergence.
Divergence is often seen as a signal of a potential market reversal, indicating that the trend might soon reverse direction.
Breaking Key Levels:
When RSI breaks above the 30 line from below or drops below the 70 line from above, it is often interpreted as a buy or sell signal. These crossovers can signal market shifts.
Trading Strategy Summary:
Buy when RSI falls below 30
Sell when RSI rises above 70
Practical Examples:
Case 1: Tencent Holdings (Daily K Chart)


Coquinours : Many thanks. Very clear!