Account Info
Log Out
English
Back
Log in to access Online Inquiry
Back to the Top

September US stock trading strategy

September US stock trading strategy
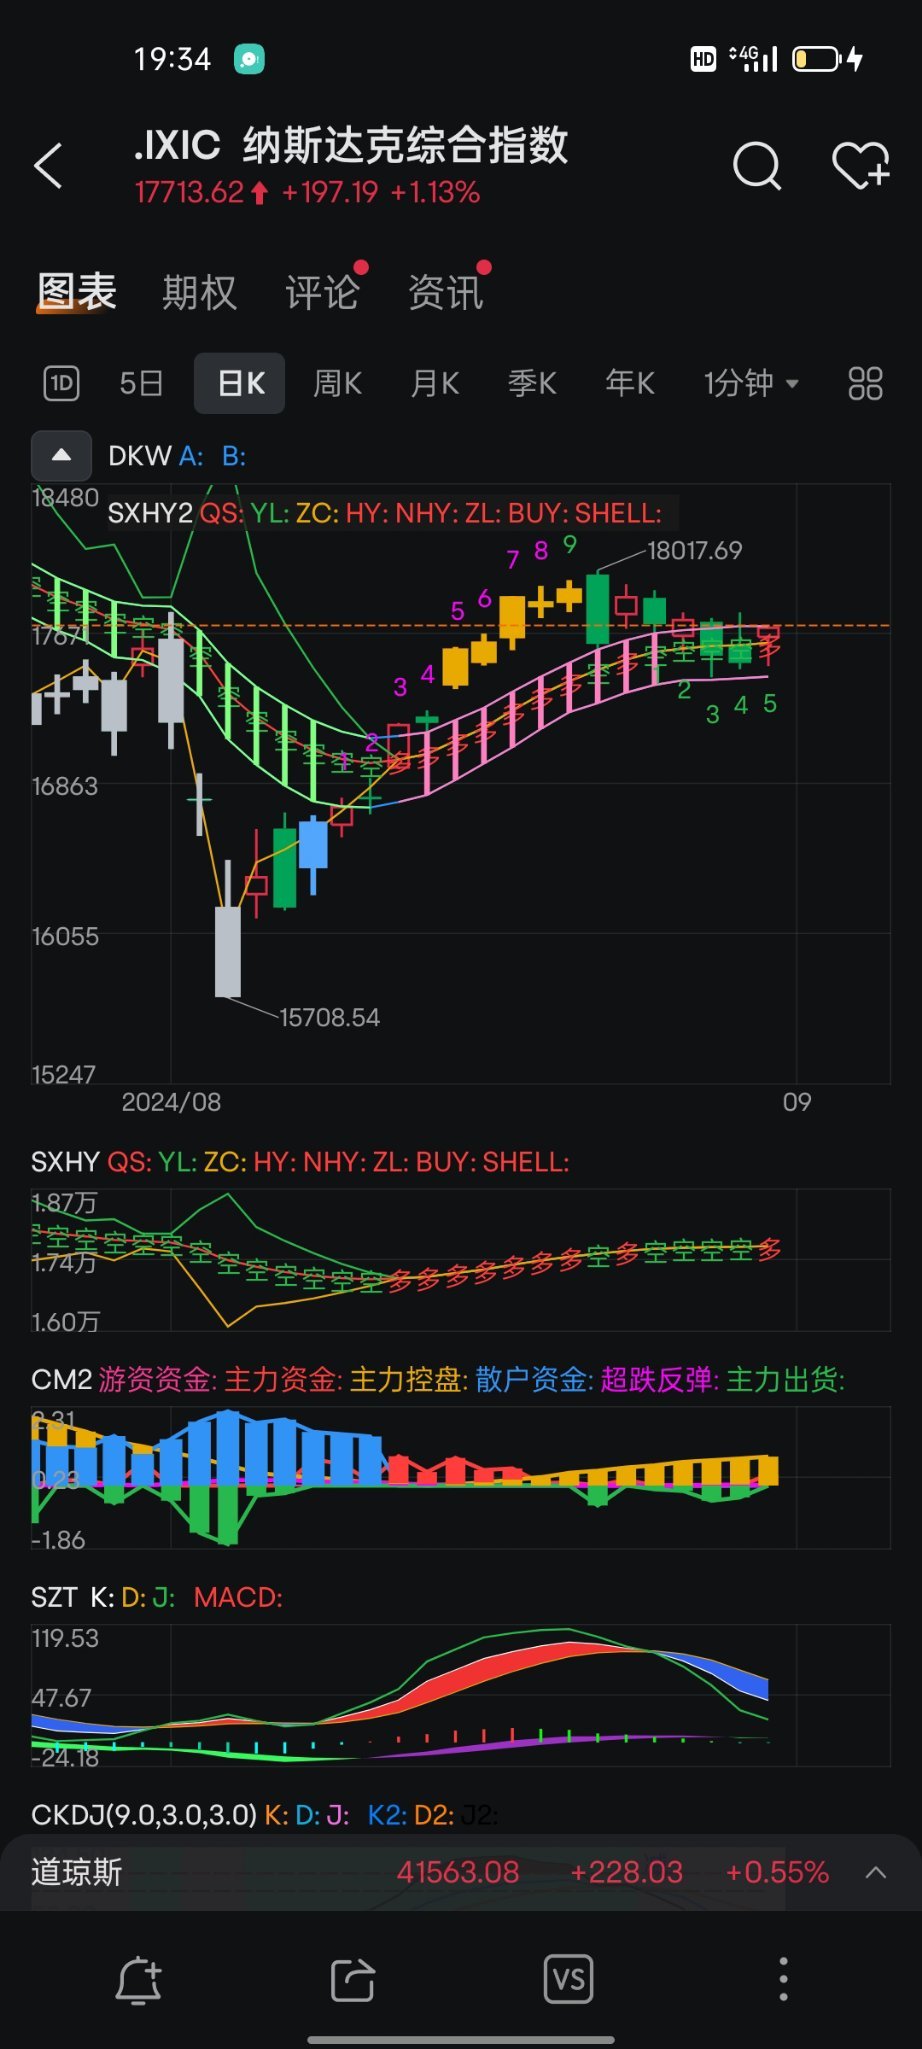
Market review: The large cap environment and the Nasdaq index dropped from over 16,000 points in early August to complete a rebound to 18,000 on the 20th. After the 20th, there was a pullback state until the end of the month. As we enter September, it remains to be seen whether the US stock market can once again usher in a rise and break through the previous 18,000 points. Based on the DKW indicator in the chart and the options market on Friday, it can be roughly speculated that the rise on Friday was completely in line with the options exercise. The digital hints from the indicators also show that the current situation is indicated by green digits [5], indicating that the market at the beginning of September still tends to be mainly downward. At this time, the market in the first week of September appears particularly important. If the opening price does show a downward trend, then the previous low point of 15,708 may be tested again. If stability is achieved, the first step is to observe the trend of the previous high point of 18,017.

First, let's introduce the 6 core indicators for stock analysis: DKW trend indicator, CM chip indicator, CD bottom-fishing indicator, SXHY long and short trading indicator, and SZT three-wave resonance indicator.
CKDJ overbought-oversold indicator.

These 6 indicators need to be combined for analysis. The indicators will change according to the changes in stock prices during trading, so there may be some differences between the post-market analysis and intraday analysis. Pay attention to buying and selling during trading.

Next, the trading strategies for individual stocks are as follows:
September US stock trading strategy
The stock of Cooper Companies (COO) has already broken out of the previous range-bound area, broken through the 100 level, and all indicators now indicate a bullish trend. According to the pink digital hint [4] from the DKW indicator, it means that there will be at least another 3-5 days of bullish trend to come. Looking at the CM chip indicator, the capital entering these two days is speculative funds, which typically prefer sudden rising markets, so it is worth continuing to keep an eye on this stock.

Intel (INTC)
September US stock trading strategy
From a technical standpoint, Intel has initiated an oversold rebound market according to the indicator hints. Currently, the pink digital hint [1] indicates that the next 7-9 trading days will be bullish. Looking at the CM chip indicator, it can also be seen that major funds have entered the market for long positions. Furthermore, considering the stock's industry status, the current stock price is seriously mismatched with its market industry status, and the stock price is in an oversold state. Therefore, it is worth observing the rebound strength of this stock. Nvidia's stock price is expected to enter a bearish trend in September, and funds coming out of Nvidia at that time may choose such valuable targets.
September US stock trading strategy
The stock price of Novartis AG has entered a phase of accelerating growth. The previous recommendation in the group was to enter at a price of 92 yuan. It was actually a good entry point when the stock price was about to reach a new high in mid-August. Although the stock price has been rising slowly, it is better to have a slow bull market than to chase daily ups and downs. It's a rhythm of winning without much effort. Currently, on the weekly chart, it has entered the second phase of acceleration, so there may be another outbreak of a sudden surge in the future. This will attract the attention of market investors and provide an opportunity for gradual selling. It takes time for the main funds to build positions, so it is not possible to sell out at once. Therefore, there will be a gradual selling process. As for the current stock price, there is still a long way to go for the main funds to sell, so those who hold chips don't need to worry too much about the fear of heights. According to the DKW indicator and the CD CM indicator, the current trend is a strong bullish market with dominant funds controlling the market. When the stock price falls below the DKW pink ladder and turns green, it may be a good time to consider exiting. $Lululemon Athletica (LULU.US)$ $Novartis AG (NVS.US)$ $Advanced Micro Devices (AMD.US)$
September US stock trading strategy
Disclaimer: Community is offered by Moomoo Technologies Inc. and is for educational purposes only. Read more
4
+0
1
See Original
Report
15K Views
Comment
Sign in to post a comment
174Followers
26Following
705Visitors
Follow