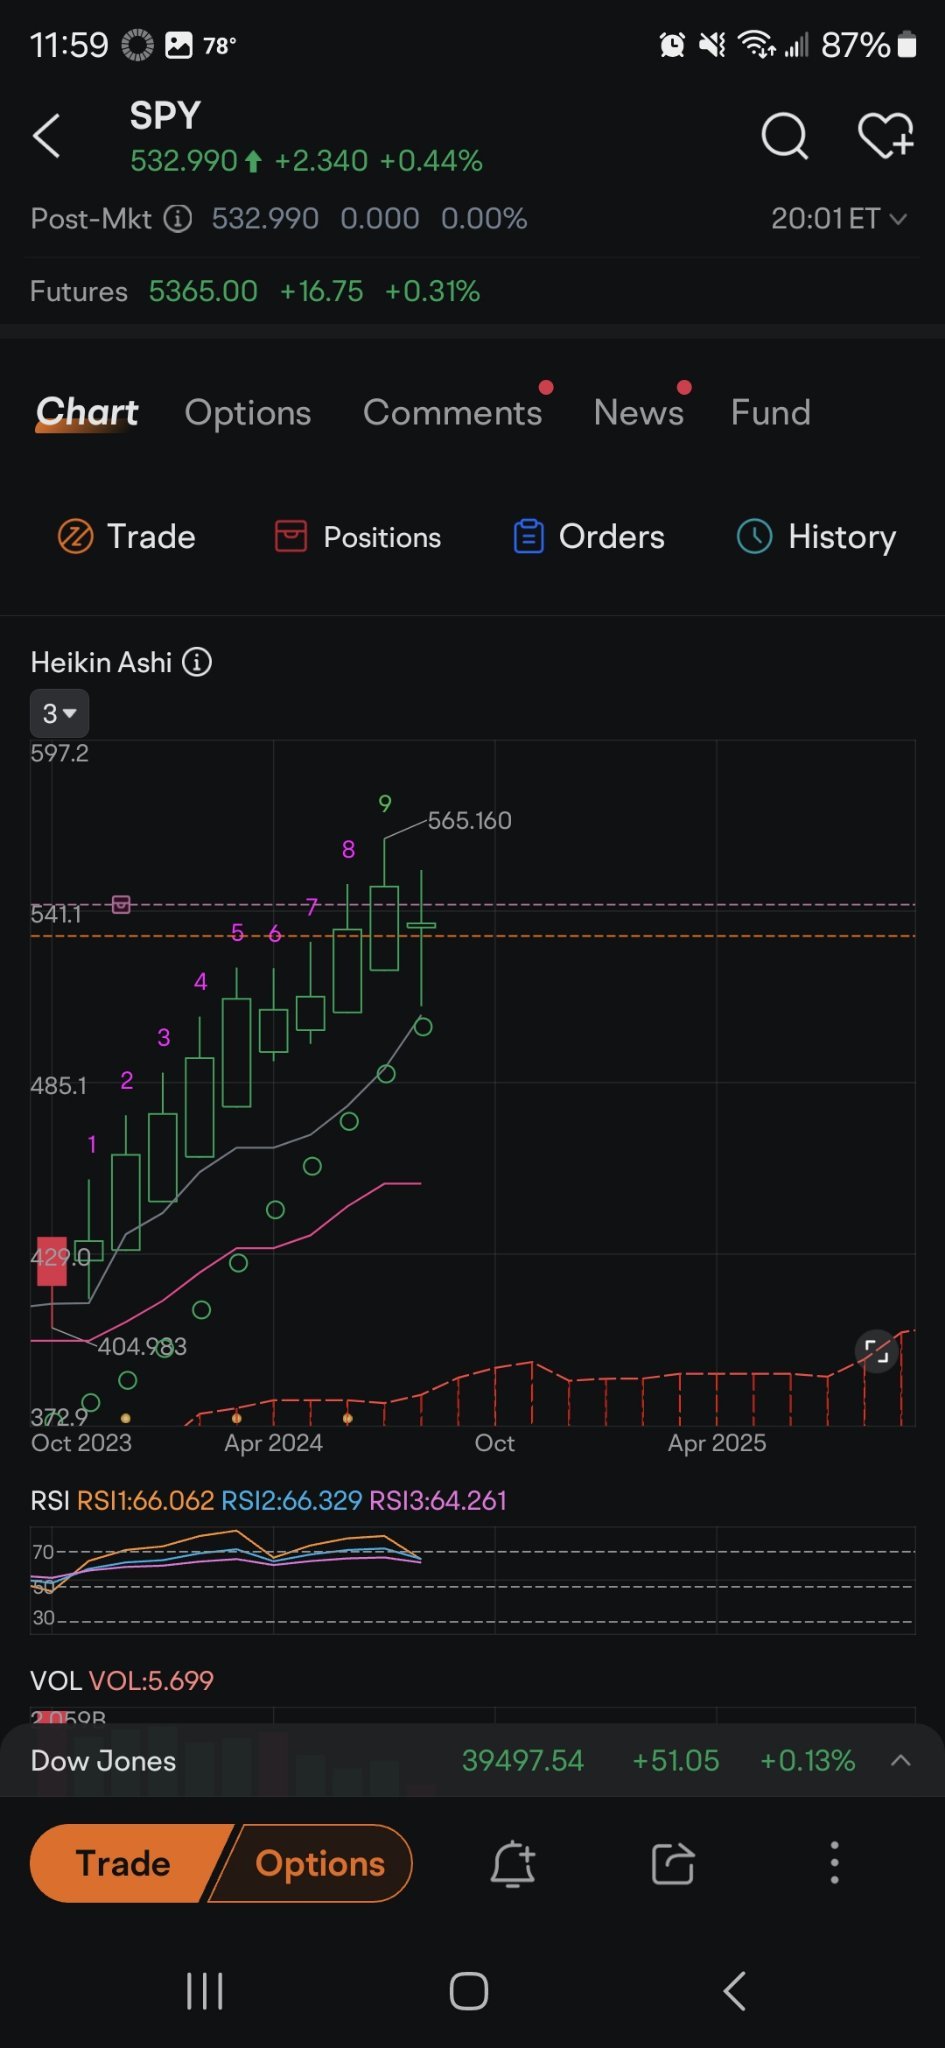
$SPDR S&P 500 ETF (SPY.US)$ monthly chart long candle needs ...
monthly chart long candle needs to fill more this drip is the red zone in second daily chart. the 510ish bottom, no body yet needs to fill now making it resemble the 9 behind it. what we don't want to see is this green candle fail to fill and turn red then another red one cutting off the row of greens dots because then bearish downturn where the line of red sars dots starts. which could happen easily but since market hates uncertainty anticipation of cpi data usually drags it down too. but then again we are recovering from a dip where last Monday could've been lowest but could definitely see a short leg down. it usually all lines up with those red dots landing which still hasn't happened in short term maybe after cpi


the last chart shows why sometimes a downturn doesn't really matter at all. the green candle lengths almost line up as much as the reds. hence the newly formed thin body long wicked green candle on the first chart get it? this is why I will hold during a correction without fear. you need faith in the stock market. Basically even in a bear market the spikes that occur coming down the right backside of the mountain are some of the best rallies the market has to offer. they're hard to time and shorts burn there so you're better off just holding.
Disclaimer: Community is offered by Moomoo Technologies Inc. and is for educational purposes only.
Read more
Comment
Sign in to post a comment

Ultratech OP GeiGei : everything I say is based off speculation. but yes be aware of the candle stick wicks and the bodies of them they will fill one way other another. a lot of the time a stock may be in an uptrend during day but just sitting in a single red candle
Ultratech OP GeiGei : it's always a safe bet to sell quickly for profit especially penny stocks but big tech blue chips you don't actually take any loss obviously unless you sell.. going to heavy too fast or not holding long enough decline is temporary. doesn't matter they always go back up if it's a good stock or sp500/nasdaq etf. it might dip pullback correct etc but it's definitely not actually crashing. eventually comes back right where it left off and inches along