US Stocks Plunge as Sept Kicks Off. What's Behind the Drop and How to Protect Your Portfolio?
Despite the market's widely accepted expectation of some seasonal weakness in the US stock market in September, investors were caught off guard by the sharp drop on the first trading day of September.
The $S&P 500 Index (.SPX.US)$ fell by over 2.1% on Tuesday, while the $Dow Jones Industrial Average (.DJI.US)$ dropped 1.5% and breached the 41,000-point mark, marking the largest single-day decline since the global turbulence in early August. The Wall Street "fear gauge" $CBOE Volatility S&P 500 Index (.VIX.US)$ surged over 40% at one point and approached 22, exceeding its long-term average, marking its highest level in three weeks. Technology stocks, which had seen significant pullbacks earlier, were hit hard again, with the $Nasdaq Composite Index (.IXIC.US)$ plummeting by 3.3% and the $PHLX Semiconductor Index (.SOX.US)$ plunging by 7.8%. AI darling $NVIDIA (NVDA.US)$ closed down by 9.5%, witnessing a market capitalization decline of over $250 billion, marking the deepest drop among US individual stocks.
What Sparked the Market Downturn?
● Economic Data Revives Hard Landing Concerns
The US ISM Manufacturing PMI came in at 47.2 in August, below the expected 47.5. Within the sub-indices, the New Orders index continued its decline from 47.4 last month to 44.6, marking its lowest level since June 2023. The ISM New Orders/Inventories, regarded as a top leading indicator for the ISM Manufacturing Index, suddenly plunged back into recession territory, indicating significant issues within the manufacturing sector.
What's worse, the final reading for the US Markit Manufacturing PMI in August was 47.9, also falling short of the projected 48. Both sets of manufacturing data for August remain in a contractionary phase, reflecting similar trends in many sub-indices. Coupled with the disappointing July construction spending data released on the same day, a series of economic indicators have reignited concerns among investors about a slowdown in the US economy, triggering a sell-off in the stock market.
The critical August non-farm payroll report will be released this Friday, serving as the final major labor market data point before the Federal Reserve's September decision. This report will provide further insights into the state of employment and the overall economic conditions in the U.S.
● Bank of Japan Hints at Rate Hike
Following the hawkish remarks made during the questioning session at the Japanese parliament on August 23, Bank of Japan Governor Kazuo Ueda reiterated on Tuesday that the central bank will continue with interest rate hikes if economic and price data meet expectations. With the recent unexpected hawkish stance, it is widely expected in the market that the BOJ still has room for further rate hikes this year. Against the backdrop of the divergence in monetary policies between the US and Japan and the narrowing of the interest rate differentials between the two countries, the risks of yen carry trades reversing have intensified once again.
In late July this year, a massive unwinding of yen carry trades triggered a sell-off in stocks, leading to a global stock market plunge. The $Nikkei 225 (.N225.JP)$ experienced a sharp drop of over 12% on "Black Monday" on August 5, while the $S&P 500 Index (.SPX.US)$ also fell by 3%. Although the impact of yen carry trades has gradually diminished in recent times and both the US and Japanese stock markets have regained some lost ground, Arif Husain, the head of fixed income at T. Rowe Price who had successfully predicted the yen crisis, has warned that the crisis in August was just a dress rehearsal. Investors have only witnessed the first phase of this turbulence, and he anticipates that market volatility will further increase in the future. Husain believes that the expected rate cuts by the Federal Reserve and further tightening measures by the Bank of Japan could once again shake the markets soon.
● Seasonal Sell-Off Sparks Market Volatility
September has historically been the worst month for average returns in the US stock market. Since 1990, the S&P 500 Index has seen an average decline of 1.04% in September, with only a 47% probability of closing higher. This seasonal effect has been particularly pronounced in recent years, with the S&P 500 Index experiencing declines of 3.9%, 4.8%, 9.3%, and 4.9% in the past four September (2020-2023). The reasons for this seasonal decline are varied, including traders re-entering the market and reassessing their portfolios after the Labor Day holiday in the US, increasing market volume and heightening volatility. Additionally, mutual funds selling losing positions at quarter-end to reduce capital gains distributions, households cashing out stocks for education expenses, and seasonal mood biases are also possible factors.
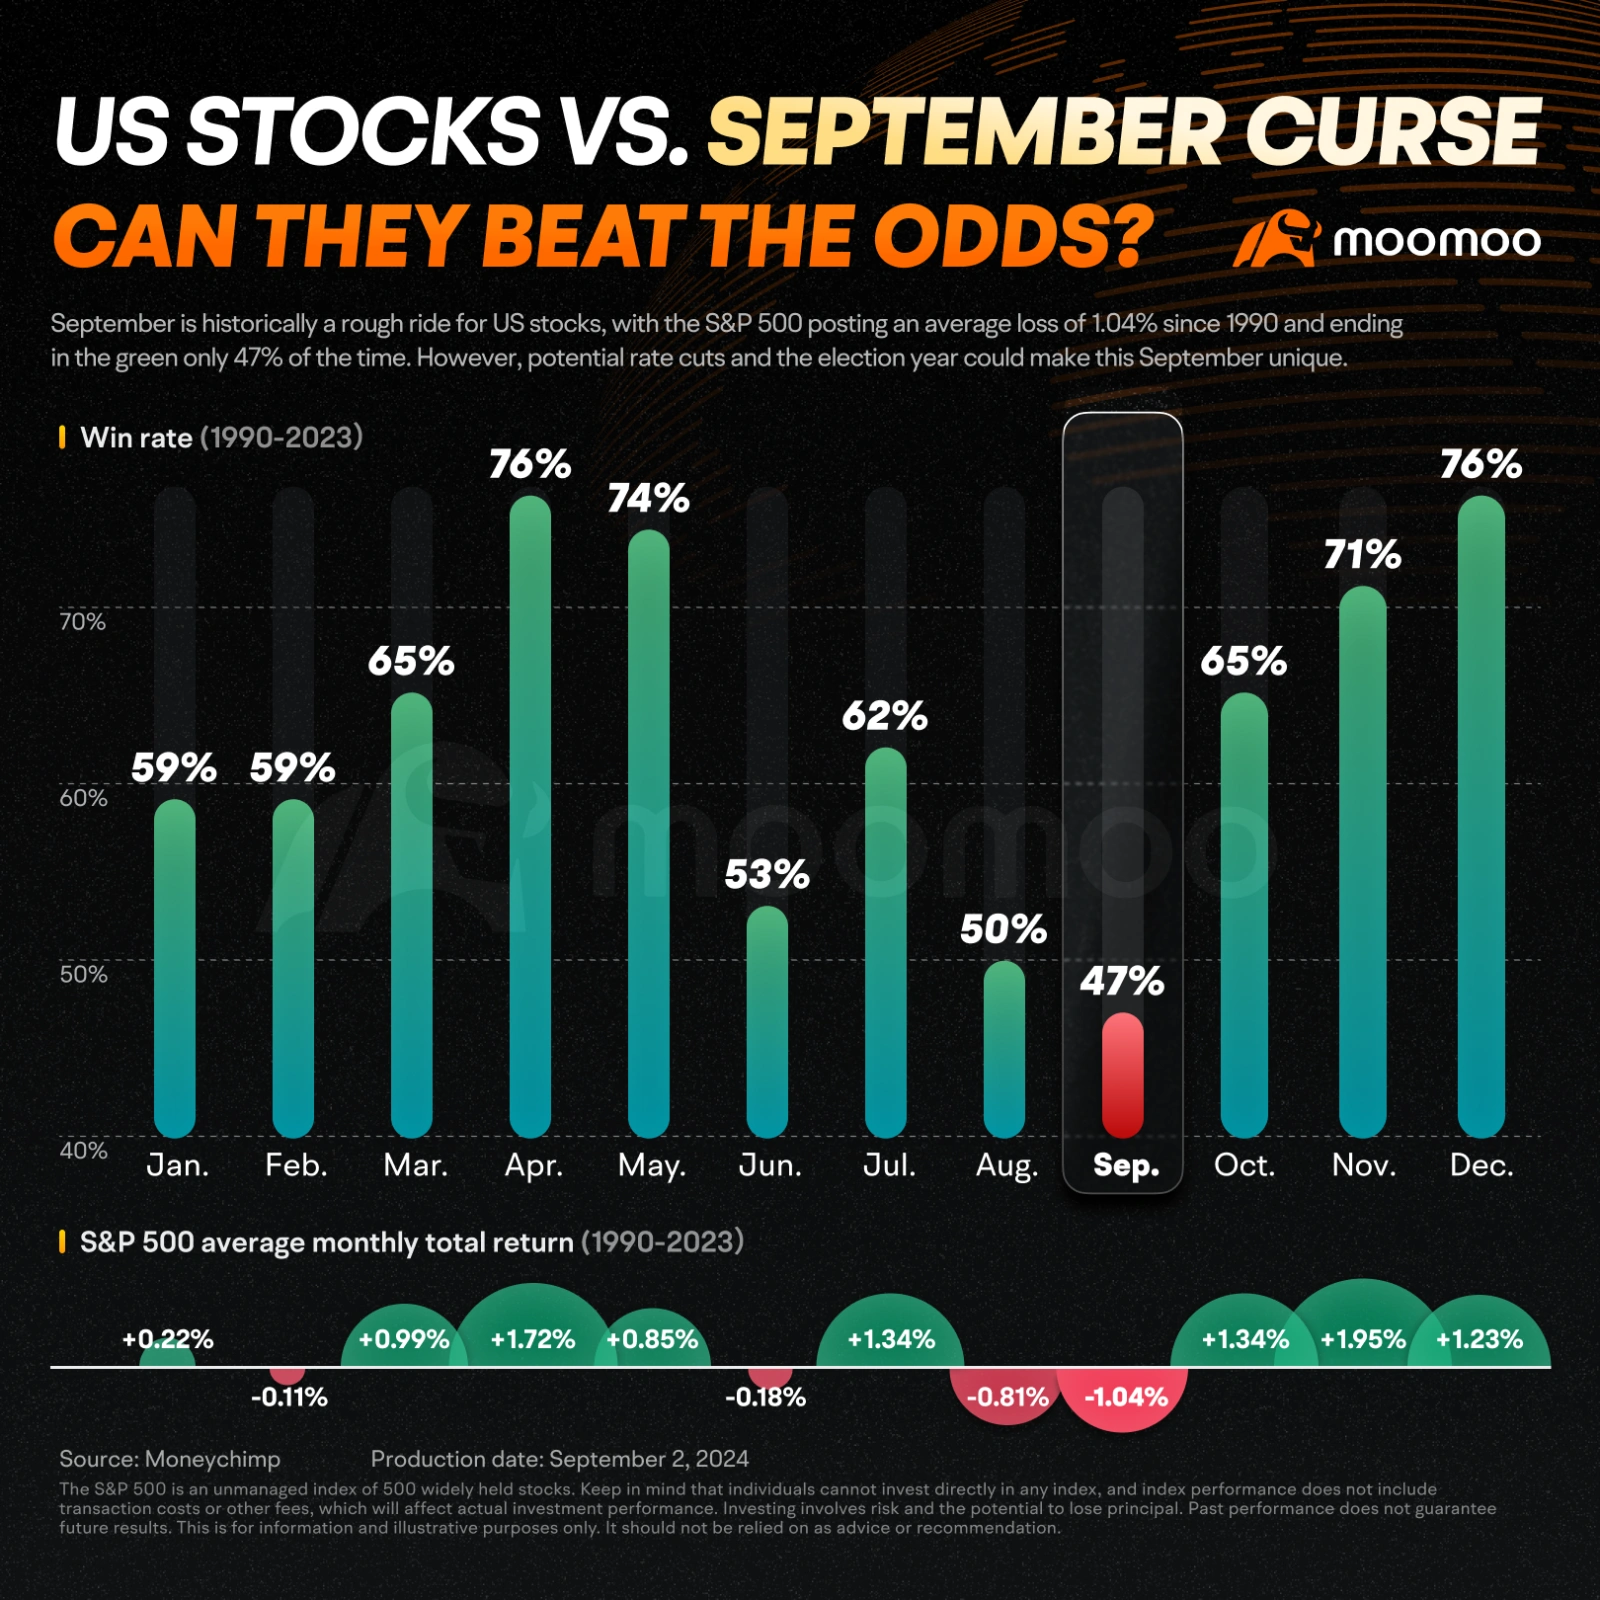
It is worth noting that the negative seasonal effect on chip stocks is particularly pronounced. Over the past 30 years, the Philadelphia Semiconductor Index has dropped in September 60% of the time, with an average decline of 2.69%. Furthermore, the index has experienced this pain in September for four consecutive years. To make matters worse, the Semiconductor Industry Association (SIA) released July chip sales data on Tuesday, which fell below seasonal trends and indicated signs of industry weakness, with chip sales in June and July dropping by 11.1%, below the 5-year and 10-year averages. This indicates that, in addition to seasonal headwinds, the semiconductor sector is also facing fundamental downward risks.
● Nvidia's Earnings Aftermath Impacts Market Sentiment
Since the release of a less-than-stellar earnings report last week, the aftershocks of the sell-off in Nvidia continued into Tuesday. Some analysts believe that Nvidia is merely grappling with the growing pains of its expansion, while others suggest that the earnings report has sparked doubts about the sustainability of massive investments in AI hardware. The stock has declined by 14% since the earnings announcement on August 28, indicating a significant increase in controversy surrounding the AI concept. Furthermore, Bloomberg reported that the U.S. Department of Justice has issued subpoenas to Nvidia and other companies, seeking evidence of Nvidia's potential antitrust violations. This rising regulatory risk adds to Nvidia's woes.
As a key barometer of sentiment in the U.S. stock market, Nvidia's ongoing decline is impacting overall risk appetite among investors. There has been a notable resurgence of risk-off and recessionary trading in the market.
How to Defend Your Portfolio?
Following the release of weak manufacturing data on Tuesday, traders are currently maintaining the expectation that the Federal Reserve will cut interest rates by 25 basis points four times this year, with the likelihood of a significant 50 basis point cut in September increasing from 30% to 43% from the previous day. Looking ahead, if the Fed delivers a smaller rate cut than expected in September or provides a vague outlook on future rate cuts, the August non-farm payroll data remains weak, and the uncertainty surrounding the U.S. presidential election escalates, the market may continue to face challenges in the autumn. Against this backdrop, some investors have already begun exploring potential strategies to protect their investment portfolios from market volatility.
● US Treasury ETFs: US Treasuries, as a traditional safe-haven asset, generally perform well during market turbulence. Moreover, the upcoming rate cut is also favorable for bond assets. Investors can consider investing in US Treasury ETFs or other vehicles to gain exposure to US Treasury assets.
● Defensive Stocks or related ETFs: Typically, sectors such as utilities and consumer staples, which offer high dividends, demonstrate more investment value in a rate-cut environment. In the face of potential market volatility, stocks in these sectors with stable dividend growth and high free cash flow yields also possess stronger defensive characteristics.
● Volatility Trading: Following the market turbulence on Tuesday, the VIX index has surged above 20, surpassing its long-term average. However, if investors believe that the current panic sentiment will continue to linger, they can hedge against market volatility by betting on an increase in the VIX, such as purchasing VIX-related ETFs or VIX call options. Conversely, if the VIX suddenly spikes significantly above its average, investors can bet on a decline in the VIX.
● Inverse ETFs: In the US stock market, there are leveraged inverse ETFs available for companies like NVIDIA, the semiconductor sector, and the Nasdaq. Investors can use these inverse ETFs to hedge against downside risks in their portfolios.
Source: Bloomberg, moomoo
Disclaimer: Moomoo Technologies Inc. is providing this content for information and educational use only.
Read more
Comment
Sign in to post a comment