Sunday Update Mar 3
I'm going to try something new. I'm going to make a Sunday post so that it can be read before the market opens. I hope to still do my update before the market opens on Monday, I always want to see how futures move overnight.
This new thing I'm trying will be some random thoughts about the market. How to use some features on moomoo (a request by some) to do research and develop trading levels. To show this I will introduce some stocks iam in or will be starting positions in.
First, a welcome to Malaysia 🇲🇾 😊 !!!!
I wish you all luck 🍀 and offer a welcome to Moomoo. My favorite part about moomoo is the community ❤️. it's the best community. It offers anything you are looking for. There is humor and trading. I myself land somewhere in between 🤣 Moomoo also has excellent research and charting tools. Hopefully, I can show some to help your trading 😉
OK, the intro is out if the way. let's get into the markets.
Something is moving 🤔
here are the major components of the Russell
here is how to find that on moomoo:
type in your stock and go to that page.
select Fund
that will take you here
from this page, you can scroll the holdings. If you select one, it will take you to that stocks page. For example, I selected CYTK from the list, and it took me here
Under the Fund tab, you can also see stock information. In this case, it is an ETF. So it is a basket of many stocks.
but you could find all that information under Profile
that supplies you with all the information on the asset you're looking at.
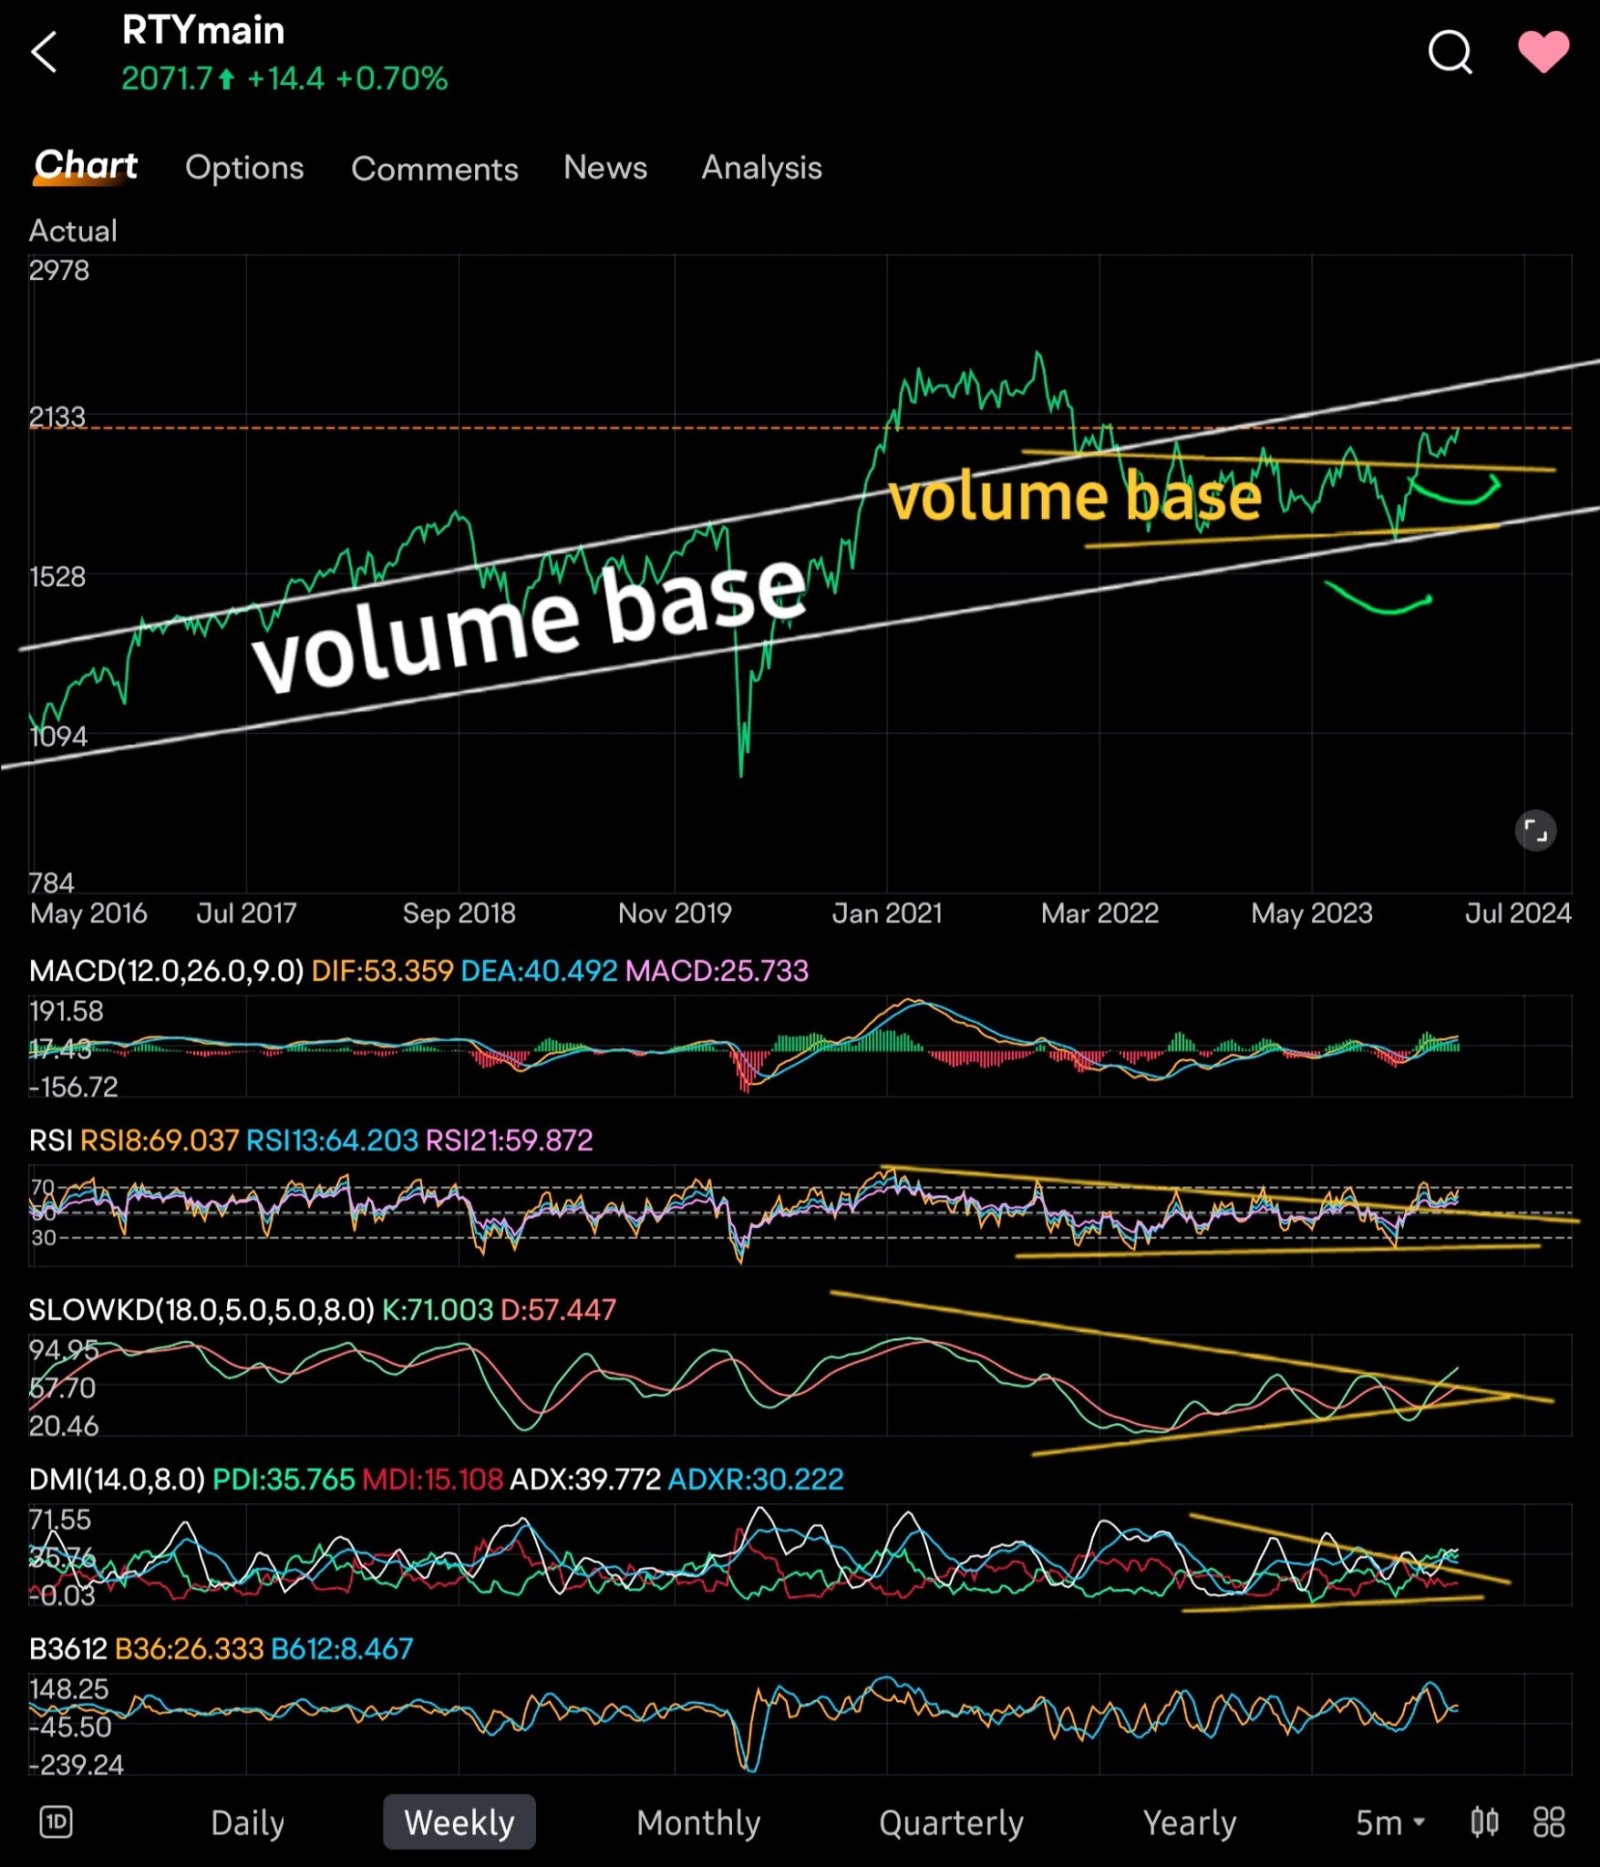
Why is the IWM breaking out?
$Micro 10-Year Yield Futures(MAR4) (10Ymain.US)$
Rates coming down is good for the Russell. The red lines are divergences. The price went higher, but the momentum went lower. There is a gap below to be filled before continuing up.
the Russell is breaking out
- BUT -
There is a catch. Just like the Nasdaq, DOW, and S&P, not all stocks run evenly. There are winners and losers. Don't bet on losers 😆😉
The market wants SPECIFIC stocks.
The fed may cut rates. that would be a huge mistake. but they may make that huge mistake. the result would be continued inflation buying. The market is buying companies that have
1. Streamlined (layoffs)
2. Make money (are profitable)
3. Offer dividends and stock buybacks
That's all they want. and for good reason. As inflation continues, these companies continue to grow revenue (they keep up with inflation), and with that revenue, they purchase stock back, thus lowering the available float. this increases their earnings per share (earnings grow and shares decrease - that is what is happening now)
here is a live example with
To find which direction the different sectors are moving, go to the Discover section
select Markets, followed by US
scroll down this section until you reach Investment Themes
this breaks down the many different sectors and how much they are moving. You can sort them and change the length of time calculated by selecting the Hot button.
Let's look at a few stocks that I have positions in or will be starting positions in from the Russell.
the top holding is
that looks like it just broke out of a triangle. 😉 I 💚 triangles! 🔺️🔻 I sense new highs coming.
looks to be coming up from a falling wedge
it got destroyed at earnings and like palo it is now coming back.
And here is a special look at
a full breakdown of mara.
this is MARA
They are a crypto miner. They are at the start of an impulse wave. This is a baby monster being born.
This is very important. see all the overlapping? down peaks entering up peaks (a normal wave does not have overlap, support holds 😉)
That means that this is an impulsive diagonal. a diagonal is how waves start or end. they are either wave 1s or 5s. or As or Cs
Here is a textbook wave 1 beginning Diagonal
(the markets are currently in a diagonal 😉)
Here is Mara with that chart imposed next to it for comparison.
Below is a channel I drew, simply connecting major points in mara. The fib numbers are from the start of the impulse to the bottom of the pullback. We should continue up to new highs and beyond, before that big wave 2 drop.
Mara could sink back below 10, below 3, even. and that will scare the s* out of everyone holding. you'll hear -
their equipment is outdated
they're not profitable
energy is too expensive
they're facing regulation
they lost management
they're not profitable
energy is too expensive
they're facing regulation
they lost management
all of these are just words in the building of a business. the same was said about Apple, Amazon, Nvidia...
it seems easy...
oh, I'll buy the dip...
but it will be so bad, and you will be so scared 😱 and panicked that nothing will survive. you will hoard your money, afraid to let it out of your sight. And that is the time to let go. if buying the dip was easy, everyone would be rich 😆
the trick is knowing the right dip and the matching chips 😁 did anyone think buying the dips last week was easy?
well, I did. but how many others bought all these dips? I was loading the boat with nvidia at 775 and tqqq every day... I had no problem buying because I believe in my charts, and i have faith that I was going to get paid. 🤑
********************
OK, done is the Russell the 10 year and a wave explanation on Mara.
How about back to the Nasdaq, because the nasdaq continues to squeeze up. we may hit some big targets still in this wave. I still have 448 and then 450, but clearly this can go higher.
There are bearish divergences everywhere, so I expect a pullback soon. I expect to hit 450 first. Maybe we reverse Wednesday with Powell testimony to congress 🙄
I will go over more near-term Qs with my morning post.
I will show how to set up the channels and the fib numbers using
and
IXIC
go to the asset you would like to chart and select the settings box 🔲 in the lower right.
Select Draw lines
the 2 I will use will be the Parallel Channel and Trend-Based Fib Extension
first the Parallel Channel
Extend the line to the next lowest point up. Making the 3 rd point is key. Find a point that contacts the upper limit. It should correspond with a series of contact points on the middle trendline.
This gives us a target for the move. Around 17,000
Now let's add some fibs.
Fib point 3 at the bottom of the trend that gives us a 100% extension of 16,876 that matches the trndline around tomorrow 😳😆 can we do it? sure, but I would look more for several days.
Bi picture Weekly chart has 98 as only a 78% extension, and I would expect 161%! That would definitely put us at the top of the trend.
The squeeze continues.
With the markets squeezing and financial conditions easing, inflation should start running hot again. 🔥 🥵 I like energy and metals right now.
Hopefully you enjoyed my Sunday post.
Be Safe, Be Careful, Be Wise
and as always
Good Luck
Disclaimer: Community is offered by Moomoo Technologies Inc. and is for educational purposes only.
Read more
Comment
Sign in to post a comment
TinkerB3ll : Happy Sunday and this is definitely a good move too that we can read ahead of the weekend :) kudos to your effort for constantly sharing your thoughts
icezzz : Thanks for sharing, info really helpful
humorous Squirrel_48 : I've been optimistic about IWM since the beginning of the year. The Federal Reserve cut interest rates this year. IWM is definitely a dark horse, and I love Mara, but I have been following RIOT and COIN for a long time. I think their trends should be similar. Thanks iamiam, your analysis is very reliable! However, if QQQ and SPY start to pull back, it will be difficult for IWM to continue to rise. Perhaps the best situation is sideways trading. There may also be some pullbacks, but I will stick to buy the dip
JonnyBets : that wave thing is very interesting
CK 淡淡定有錢剩 : Love it.
iamiam OP CK 淡淡定有錢剩 : thank you
10baggerbamm : I've traded the leveraged Russell TNA several times and have a pretty good chunk at 32 and 1/4 3,000 shares now and I was way early started buying and trading last July when everybody was calling for the broader markets to expand the valuations multiple expansions and revenue growth and asset shifting and of course it didn't happen so I've been profitable traded around the core position at a loss on the court position bought more to average down when the secondary position came back sold that and now I've got a nice core position that looks like we're going to have a breakout knock wood into the low 40s it'll find resistance looks like it about 42 and 1/2 the upper Bollinger band on the leveraged ETF TNA. if we can get a broader expansion I think that by midsummer we can push the 60 on The leverage ETF and that would be my exit for my core position.
Gigigee : hi i am new to trading and your post is the first one i saw. Any tips on if i should buy Mara?
iamiam OP Gigigee : tomorrow is going to be bonkers. if direction is up, then there is upside. if we sell off, then i wouldn't. It can drop a lot.
Gigigee : thanks for your response! So meaning I don't buy it now is it? anyway no harm trying right?
View more comments...