Technical Analysis 101 | Chapter 1: The essentials
Hey, mooers!
Ever unsure about making a trade, even when it seems fine?
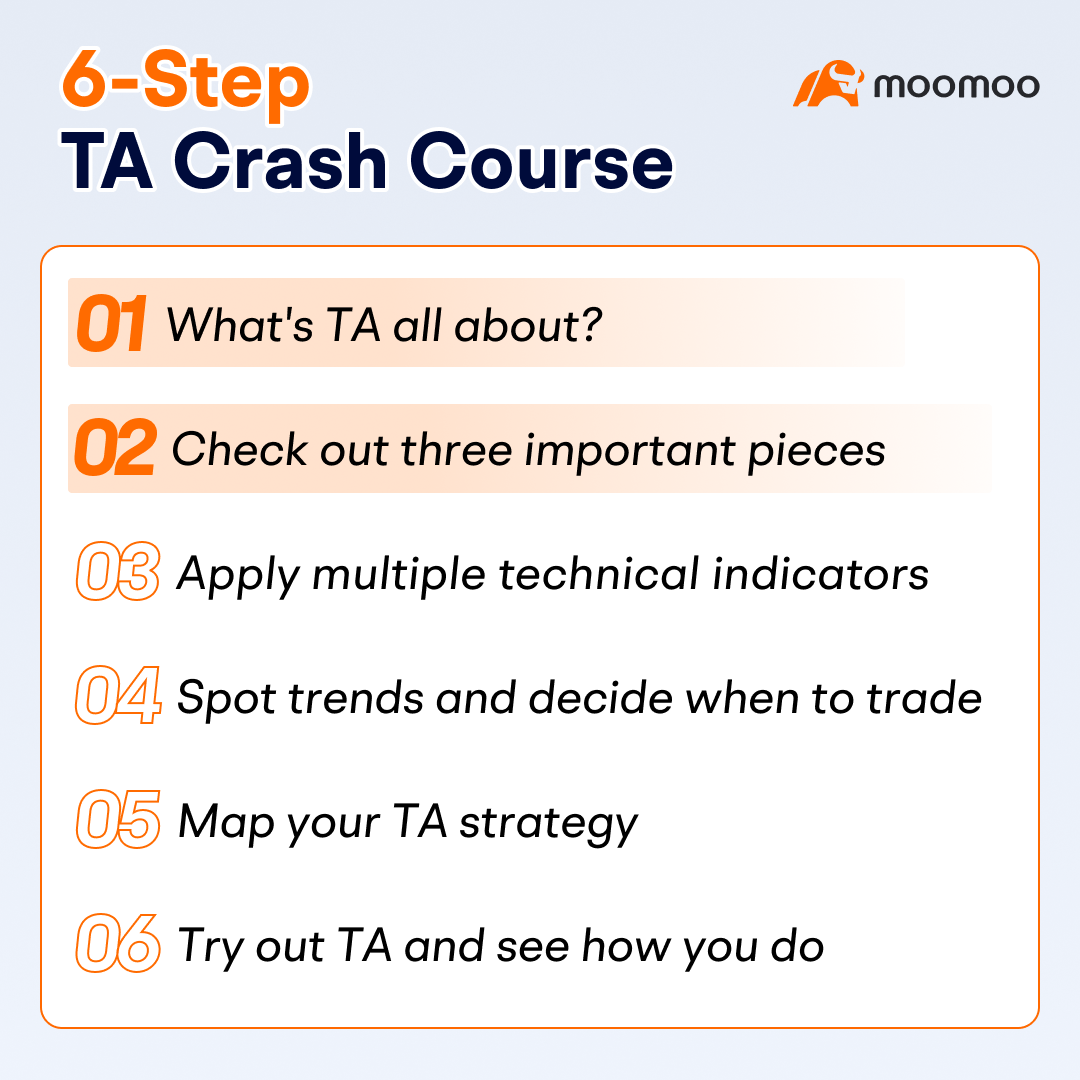
Technical Analysis (TA) can be one of the valuable methods for identifying potential trading opportunities. New to trading or to moomoo? You may want a way to make better sense of the market more quickly with charts. Imagine the potential to spot the opportune time to get in and out of a trade for extra profit using clearly indicated signals. Worried about getting lost in complex chart patterns and terms? Ready to tackle TA step by step? Start with our easy "6-Step TA Crash Course" below.
Technical Analysis (TA) can be one of the valuable methods for identifying potential trading opportunities. New to trading or to moomoo? You may want a way to make better sense of the market more quickly with charts. Imagine the potential to spot the opportune time to get in and out of a trade for extra profit using clearly indicated signals. Worried about getting lost in complex chart patterns and terms? Ready to tackle TA step by step? Start with our easy "6-Step TA Crash Course" below.
Don't forget to hit the like❤️ and save⭐ buttons to keep this post handy!

What's TA all about?
Technical Analysis is the practice of examining how stocks are traded by analyzing their prices and the volume of trades. It can be a valuable method to help you understand past performance and make informed decisions in trading. Unlike fundamental analysis, which looks at the company's earnings and other financials, TA uses past trades to provide insights into potential price movements, but it does not guarantee any future outcomes.

Get to know three important pieces
Candlesticks are the basic building blocks of a chart. A long upper shadow can suggest stock price might not climb higher, and long tails may hint that prices might not drop. When these candlesticks come together in a pattern, they can give hints on whether the stock price might be going up or down soon.


✅ Check out the insights from mooers on candlesticks and their blind spots >>
bullrider_21 | Which chart type is better?
bullrider_21 | Bearish candlestick patterns
ZnWC | Limitations of Candlestick Patterns You Need to Know
*Data contained herein from third-party providers is obtained from what are considered reliable sources. However, its accuracy, completeness or reliability cannot be guaranteed
Timeframes show you the trading data at different levels of detail. Longer timeframes (> 1 hour) give you a view of the overall trend and potentially important price levels, which can help guide your trades with the market's direction. Shorter timeframes (<1 hour) give detailed signals to help you evaluate moments to buy or sell. The timeframes you choose should match your trading style and investment objectives. Many traders focus on just one or two similar timeframes, often the 4 Hours and Daily

Technical indicators are tools that use mathematical formulas or set rules based on various market data such as price, trading volume, or open trades to provide insights into potential future price movements. They fall into two groups: Overlays, which go on the same chart as the stock price, like MAs (moving averages) and BB (Bollinger Bands), and Oscillators, which swing within a certain range, like MACD (moving average convergence-divergence) and RSI (relative strength index). Take a look at three indicators that many traders like to use.


➕ Want more info? We've got courses to help you learn.
Path: Discover > Learn > Premium Courses > Technical Indicators
Path: Discover > Learn > Premium Courses > Technical Indicators

Preview of what's next
Wondering why multiple indicators are commonly applied to identify trends? 🤔
Keep an eye out for our upcoming post, where we'll outline how to apply multiple technical indicators in your analysis and look for entry/exit signals. Keep following us for the full scoop!
Also, we're having a points event in October 1st, join for a chance to earn rewards! Event details will be posted later. Follow us to ensure you're front and center for the points giveaway! 🎉
*This presentation discusses technical analysis, other approaches, including fundamental analysis, may offer very different views. The examples provided are for illustrative purposes only and are not intended to be reflective of the results you can expect to achieve. Specific security charts used are for illustrative purposes only and are not a recommendation, offer to sell, or a solicitation of an offer to buy any security.
Disclaimer: Moomoo Technologies Inc. is providing this content for information and educational use only.
Read more
Comment
Sign in to post a comment

slam-dunk-1 : Good stuff.![undefined [undefined]](https://static.moomoo.com/nnq/emoji/static/image/default/default-black.png?imageMogr2/thumbnail/36x36)
Euler007 : It's worth learning!
Jrithe :![undefined [undefined]](https://static.moomoo.com/nnq/emoji/static/image/default/default-black.png?imageMogr2/thumbnail/36x36)
![undefined [undefined]](https://static.moomoo.com/nnq/emoji/static/image/default/default-black.png?imageMogr2/thumbnail/36x36)
![undefined [undefined]](https://static.moomoo.com/nnq/emoji/static/image/default/default-black.png?imageMogr2/thumbnail/36x36)
あきんちょ : Translating the Japanese text inside the figure may help you understand.
104685376 : How to save it ?
105077930 : useful
104139729 : Is there any class?
Slayer888 : TA will be one of the tools for decision making
WILLEE9ice : Yes it worth to know but definitely wasn't 100% reliability on it
nerdbull1669 : very insightful and can help one to appreciate TA to use in trading
View more comments...