English
Back
Download
Log in to access Online Inquiry
Back to the Top

Technical Analysis 101 | Chapter 2: Indicators & trading signals

avatar
Meta Moo wrote a column · Sep 26, 2024 11:04
Hey, mooers!
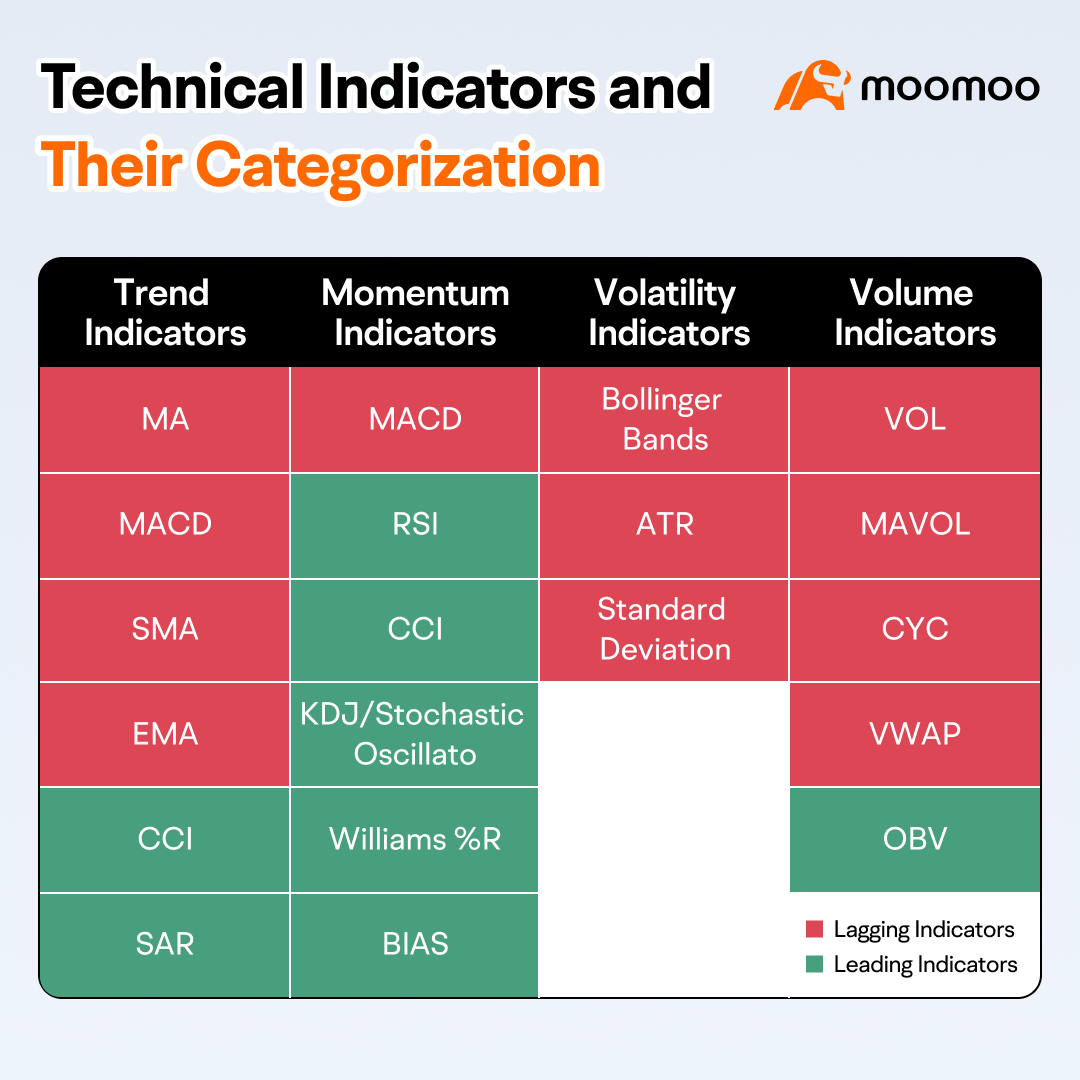
Didn't catch our intro to TA and the indicators rundown? Go back and see it here. Indicators are more useful when used together. This time, we'll guide you on applying multiple indicators to spot trends.
Applying multiple technical indicators
Finding the right mix of indicators is key for sharp technical analysis. How many should you use? Just one might not be enough to forecast trends, but too many similar ones can be overkill. Knowing the types of indicators helps you find the good mix for your investment style.
Discussion | TA Challenge Special: How to combine technical indicators effectively?
➕ Tap to check out mooers' insights on combining indicators >>
@ZZZZakk | MACD + KDJ
@CasualInvestor | MACD + KDJ + RSI
@nerdbull1669 | Trade TSLA Using MACD and KDJ
*Data contained herein from third-party providers is obtained from what are considered reliable sources. However, its accuracy, completeness or reliability cannot be guaranteed
Technical Analysis 101 | Chapter 2: Indicators & trading signals
💡 Don't worry about cluttering your chart with indicators. Moomoo's got your back. Tap to see how to customize and share your own mixes.
Spot trends and decide when to trade
Trend lines show whether asset prices are going up, down, or moving sideways. To spot these trends, you can draw lines that connect a series of increasing troughs for an uptrend or decreasing peaks for a downtrend.
Technical Analysis 101 | Chapter 2: Indicators & trading signals
Indicated support and resistance levels can suggest where prices might stop going up or down. You can choose to trade on the rebound off these levels or when the price breaks through them, which can serve as profitable strategies. However, accurately distinguishing between a real breakout and a temporary bounce is crucial for successful trading.
Technical Analysis 101 | Chapter 2: Indicators & trading signals
➕ Tap to check out mooers' insights on spotting trends >>
@Meta Moo | TA Challenge: Chart to find breakdown stocks
SpyderCall | Using Technical Support Levels to Predict Future Price Action
bullrider_21 | Descending Broadening Wedge
*Data contained herein from third-party providers is obtained from what are considered reliable sources. However, its accuracy, completeness or reliability cannot be guaranteed
💡 Drawing trendlines doesn't have to be hard. Moomoo's tools can help make it easier. Tap here to see the tutorial.
Imagine moving averages as two lines dancing. When the short-term moving average climbs over the long-term average, we see a golden cross, and it can signal a market on the rise. When it does the exact opposite and falls below, it's called a death cross, which might mean the market is about to go down.
Technical Analysis 101 | Chapter 2: Indicators & trading signals
💬 Ready to earn points? Share your thoughts!
Used any TA strategies for entering or exiting trades? Tell us your strategy, tag your stock, and include a screenshot of your trade. 🎁 Each on-topic comment earns 10 points, and the top 5 most-liked comments receive 100 points (you can't win both). Hurry, the event ends on October 7th.
Preview of what's next
Ever thought about creating a trading strategy that's just right for you? We'll tackle that in our upcoming post. Plus, don't miss our community event for exchanging TA tactics. Don't miss out!
Also, we're having a points event in October 1st, join for a chance to earn rewards! Event details will be posted later. Follow us to ensure you're front and center for the points giveaway! 🎉
*This presentation discusses technical analysis, other approaches, including fundamental analysis, may offer very different views. The examples provided are for illustrative purposes only and are not intended to be reflective of the results you can expect to achieve. Specific security charts used are for illustrative purposes only and are not a recommendation, offer to sell, or a solicitation of an offer to buy any security.
Disclaimer: Moomoo Technologies Inc. is providing this content for information and educational use only. Read more
212
28
1
1
1
1
1
+0
22
Translate
Report
189K Views
Comment
Sign in to post a comment
  • ZZZZakk : Very useful!!![undefined]

  • Stella-K : Just used the golden cross to make a trade. Fingers crossed! 🤞

  • Jrithe : Loving these insights! Trend lines and support levels are my go-to tools.

  • Blazing Option Picks : Thanks✨

  • Chia Ako : اسغسسةس

  • SupersonicBee BURRY : Stop loss stated in the chart  is using sell stop order?

  • CNNT : This is my first trade using TA as a guide to enter a position.

    Since I'm not a trader, I looked at long-term horizon first to see if there are patterns (chart 1).  This stock has periodical highs and lows post-covid. The peaks are increasingly lower, and the bottoms are trending lower recently, signifying the more recent entry points, the less attractive the short-term earning prospects. But, we have to work with the here and NOW and now does look like an entry point has opened up.

    Let's zoom into the past month and look at the short-term trend now (chart 2). I think most people will say it's premature to go in now because MACD lines have only just crossed over, and ideally, we wait for a little bit more histogram momentum to get a confirmation. Furthermore, the EMA90 has only just touched the price line and not crossed it. This means the trend can still reverse.

    I'm going in anyway (chart 3) as a bet that this will be a real breakout. So, it's either I entered prematurely and got burnt a bit, or I went in right at the bottom to gain a bit more.

    Why am I taking this bet?

    I don't plan to hold this stock for the longer term because of the macroenomy risks of the mining sector in China and the uncertainty of Brazillian government intervention in the company. This stock is more for short-term gains such as its high dividend, moderate financial performance, and trade options with it.

    At the end of the day, it's ultimately a risk and reward expectation and balance.

    Now that I've started to apply TA to my trades, I definitely feel more informed.

    Let's see how this turns out.

  • Salami Ganiyu : Educative

  • CasualInvestor :

  • 刘伯温 : thanks

View more comments...

avatar
Meta Moo
Moomoo Community Official Account
Master trading and boost your traffic with me. Chat or inquire? DM me anytime. I'm real, not a robot!
58K
Followers
587
Following
24K
Visitors
Follow
Discussing
Trump 2.0 Era: How will global markets evolve?
🎙️Discussion: 1. How will tariff policies affect the movement of key assets such as U.S. stocks, gold, and Bitcoin? 2. Given this context, Show More