The Charts Are Flashing Major Warning Signs!
Intraday Market Crash
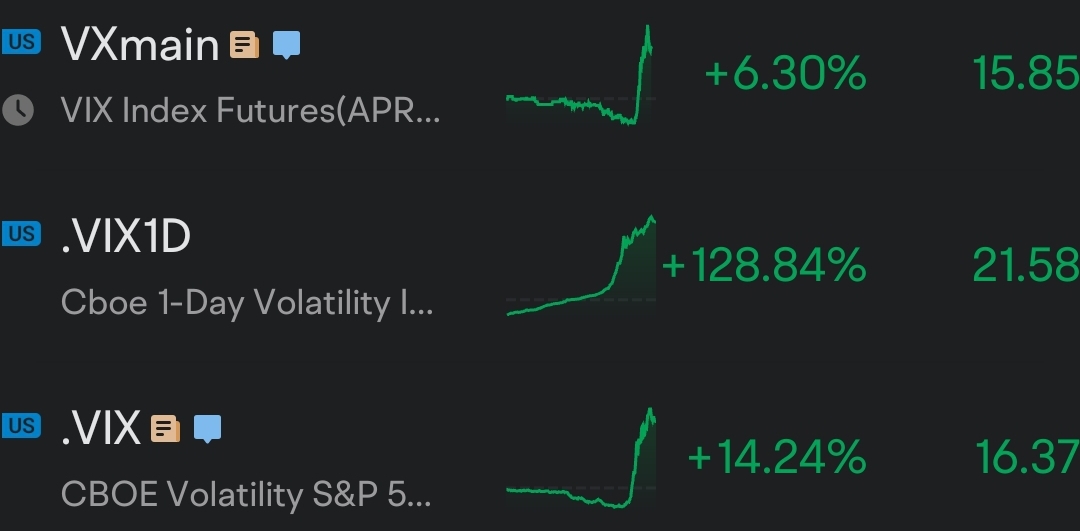
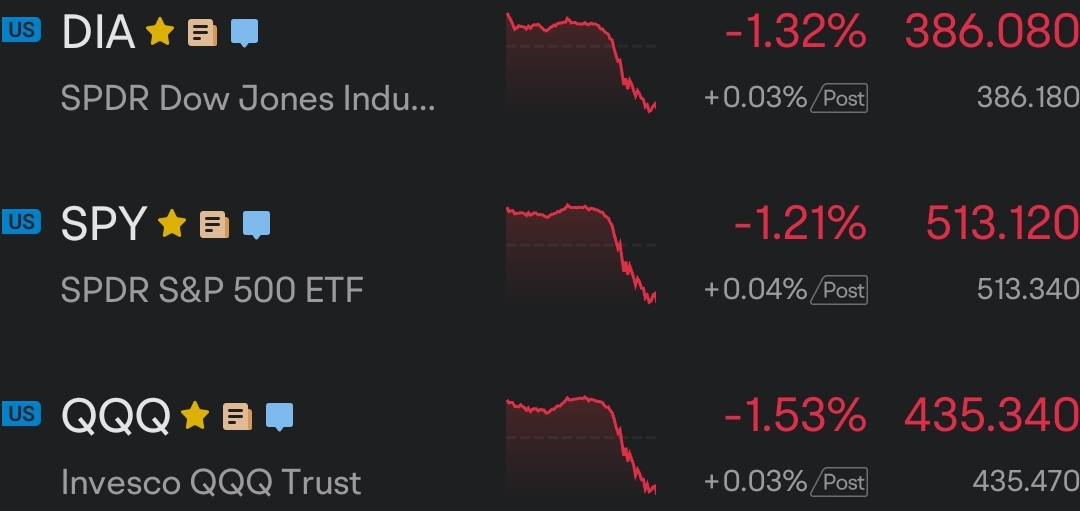
The major indices took a nose dive today. The day started off somewhat bullish but ended on a very bad note. Markets have been very over extended for quite a while now, and many investors have been anticipating a correction very soon. Is what we saw today the start of the correction everyone has been waiting for?
Bearish Technicals
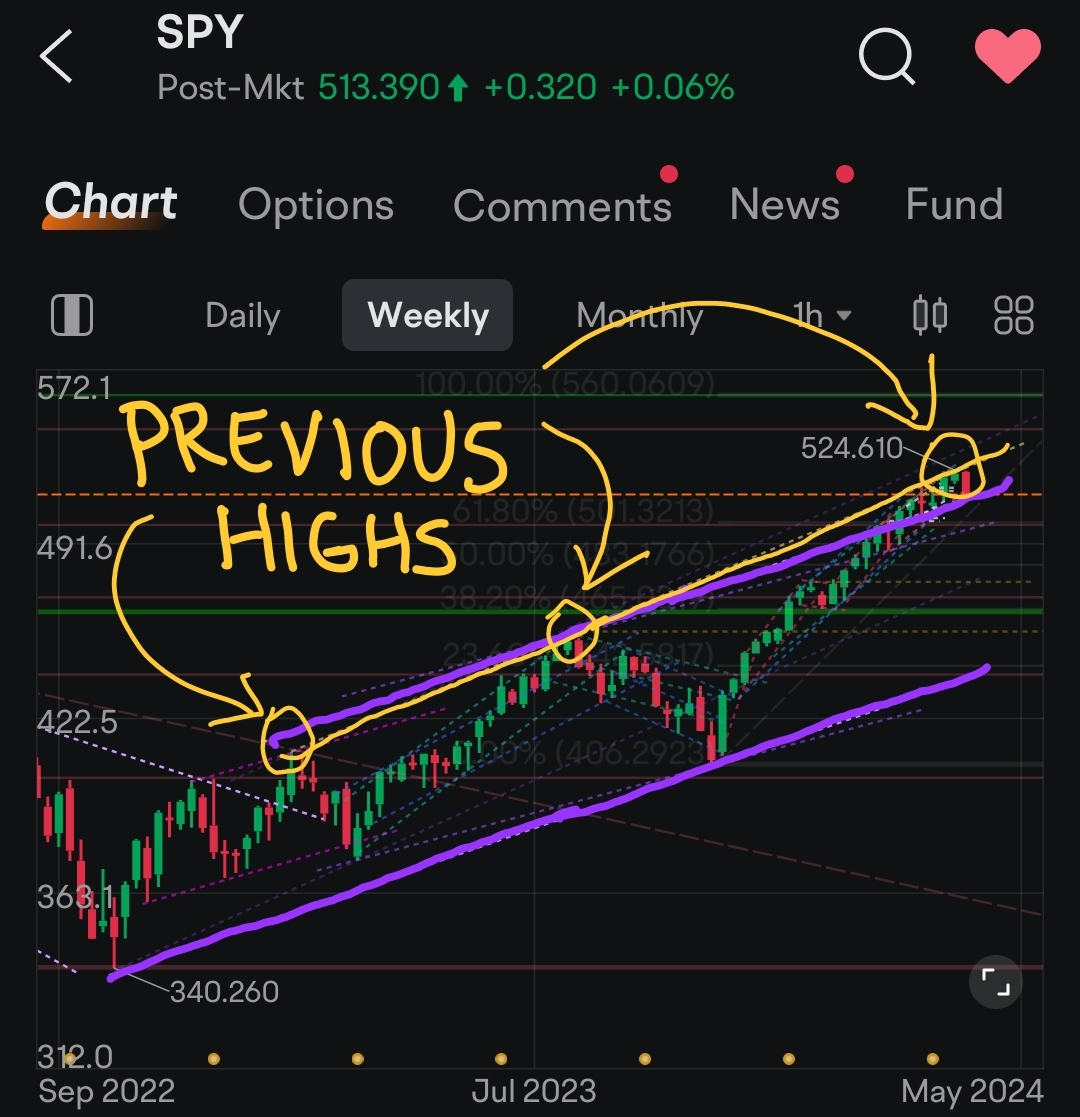
The first warning sign that I see in the technical picture is the fact that the price action is overextended near a confluence of long-term resistance levels. Right now the price is wedged between the upper resistance of a long-term price channel and a trending resistance level that connects each of the previous highs that are contained within the current rally that started over a year ago.
Huge Bearish Engulfing Candle
You can see the large bearish engulfing candle that I circled in the chart below. This big red candle essentially erased the past 10 trading days. Candles like this near long-term resistance levels during an overextended rally make me worry that a correction might be just around the corner.
I have highlighted a couple of support zones to watch just in case this correction does ensue. There is a support zone near the previous highs of the current rally and a medium-term fibonacci level to watch for potential demand or support. Nobody knows for sure exactly how low SPY will fall if and when there is a correction. But these technical levels would be the closest areas to watch if we were to experience a correction.
Relatively Weak RSI
Technically speaking, RSI is not completely in bearish territory yet. But the daily RSI is at the weakest it has been since last November when the S&P 500 climbed out of the last correction. Technically, RSI is still within somewhat neutral territory. When RSI drops below its 50 value, then this usually coincides with some degree of bearishness, at least in the short-term. So watch out for that drop below 50.
The Price Finally Dropped Below Very Strong Support Levels
In the chart directly below, I have highlighted the 20-day EMA and SMA as well as the support line that has held up the current rally since last November. You can see how strong these two support levels have been as the price has consistently rebounded off of these trend lines each time they encounter one another.
Today was the first day that the price action has closed the day below these very strong support lines. This is the first sign of weakness that we have seen in several months.
Defensive Market Positioning
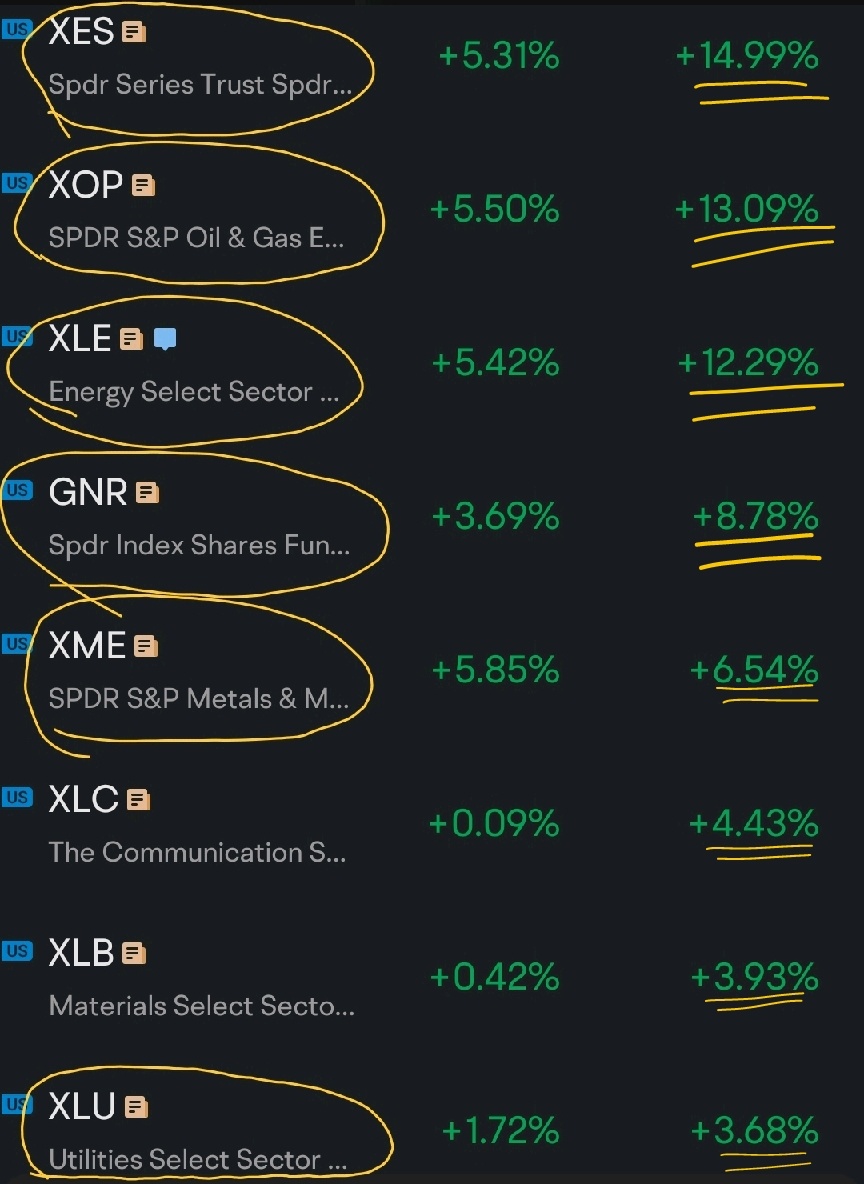
Over the past two weeks, we have seen the market building a defensive stance. The Mag 7, semiconductiors, big tech, and AI related stocks seem to have been taking a break for a couple of weeks while defensive companies have been taking the top positions with investors. Especially equities tied to inflation.
You can see how energy and oil related industries have taken the top of the chart for the past 20 trading days. Other natural resource or commodity related sectors, like metals and mining, materials, and utilities, have been very strong as well. These industries also perform well during times of high inflation or correcctive markets.
Yields Falling With the Market
The fact that we saw yields fall with the major indices is somewhat worrisome. When I see equities and yields falling at the same time, it tells me that investors are not confident in future economic growth.
Yields could be falling due to the fact that the Fed has been pushing the idea of rate cuts. But if that was the case, then it would be good for equities, and the major indices should not have sold off. It is still too early to call it, but if we continue to see yields fall with equities, then I would be more defensive like the rest of the market appears to be doing.
It Looks Like Inflation Might Be Coming Back
Energy and fuel prices have begun to rally. This is not good for all of the supposed progress the Fed has made towards its inflation goal. OPEC and U.S. oil inventories are only accomidating the energy rally. Global demand for oil is still strong, and it appears that the second largest economy in the world, China, is showing signs of an economic recovery after a few years in the doldrums.
If this trend continues, then we will almost certainly experience a resurgence in inflation. This would likely put the Fed's supposed rate cuts on hold. We might even see another rate hike if crude oil prices climb above their previous highs of $130.50. I doubt this will happen, but this would be great for commodity related equities, but it would be terrible for the tech heavy indices like SPY and QQQ.
Safe Havens are Rallying
Speaking of inflationary equities outperforming, look at this massive gold rally. It has been hard to miss these past few weeks. Gold is a great inflationary asset. If a countrys currency is depriciating, then gold would be an appealing investment as it would protect yourself from a devaluing currency. This could be the possible reason for the rally. Maybe traders are seeing inflation returning in a big way. Or maybe they see an impending recession. Gold is the perfect safe haven investment to protect yourself from a recession.
Gold initially started its climb thanks to the supposed rate cuts that push down the demand for the dollar, which indirectly pushes up the demand for gold. But very recently, the dollar has been climbing with gold. This is a very strange phenomenon. This could be caused by the fact that the U.S. dollar is considered a safe haven towards depreciating foreign currencies as well.
Perhaps investors in countries experiencing extremely high inflation right now are flocking to gold and the dollar at the same time. Or the fear of an inflation resurgence could be pushing the dollar up as investors let go of the idea of rate cuts. At the same time, inflation surging could bring back fears of stagflation, which can lead to recession, hence the demand for gold's safe haven quality. Either one of these scenarios would be generally bad for most equities.
The Market Has Been Franticly Buying Any Small Dip. Will This Dip Get Bought Up As Well?
Today is the first sign of weakness that we have seen in a very long time. Apparently, the market has been preparing for some type of correction for the past few weeks. After todays very bearish day, I am finally on board with the correction camp. But the market has been buying up every single tiny dip like there is no tomorrow. Will traders buy this dip back up like they have been doing for the past 5 months? Or will we finally see that correction that this overextended rally so desperately needs?
So what do you think, Moo'ers? Will the market quickly buy this dip? Or will we finally see the correction that everybody has been waiting for?
Good Luck Trading
As always, I am not a financial professional, and this is not investment advice. Be careful and be patient. Dont anticipate the market. Rather, participate in the market. Don't invest money that you can't afford to lose. Give some of your investments time and know when to cut your losses.
Don't be greedy. Don't invest in anything you don't understand. Don't put all of your eggs in one basket. Don't listen to the hype. Don't fomo or panic into or out of trades. Do your own due diligence. And just follow the trends. A trend is your friend. Good luck trading.
$Invesco QQQ Trust (QQQ.US)$ $iShares Russell 2000 ETF (IWM.US)$ $SPDR Dow Jones Industrial Average Trust (DIA.US)$ $Gold Futures(DEC4) (GCmain.US)$ $E-mini Dow Futures(DEC4) (YMmain.US)$ $E-mini S&P 500 Futures(DEC4) (ESmain.US)$ $E-mini NASDAQ 100 Futures(DEC4) (NQmain.US)$ $E-mini S&P MidCap 400 Futures(DEC4) (EMDmain.US)$ $E-mini Russell 2000 Index Futures(DEC4) (RTYmain.US)$ $CBOE Volatility S&P 500 Index (.VIX.US)$ $VIX Index Futures(DEC4) (VXmain.US)$
$ARK Innovation ETF (ARKK.US)$ $ARK Genomic Revolution ETF (ARKG.US)$ $ARK Next Generation Internet ETF (ARKW.US)$ $ARK Autonomous Technology & Robotics ETF (ARKQ.US)$ $ARK Fintech Innovation ETF (ARKF.US)$ $ARK Space Exploration & Innovation ETF (ARKX.US)$ $The 3D Printing ETF (PRNT.US)$ $ARK Israel Innovative Technology ETF (IZRL.US)$
$USD (USDindex.FX)$ $Powershares Exchange Traded Fd Tst Db Us Dollar Index Bullish Fund Etf (UUP.US)$ $SPDR Gold ETF (GLD.US)$ $iShares Silver Trust (SLV.US)$ $Ishares Iboxx $ High Yield Corporate Bond Etf (HYG.US)$ $Ishares Iboxx $ Investment Grade Corporate Bond Etf (LQD.US)$ $iShares 20+ Year Treasury Bond ETF (TLT.US)$ $Crude Oil Futures(JAN5) (CLmain.US)$ $VanEck Gold Miners Equity ETF (GDX.US)$ $VanEck Junior Gold Miners ETF (GDXJ.US)$
Disclaimer: Community is offered by Moomoo Technologies Inc. and is for educational purposes only.
Read more
Comment
Sign in to post a comment
RIPPER : I’m excited ……
SpyderCall OP RIPPER : Me too. I love a good dip to buy. And puts habe extremely low premiums right now. They could possibly print big time.
RIPPER : Am I the only one who saw this fall coming? I’m confused because seems like most out there were caught off guard.
All week long, I have had a gut feeling this exact fall was going to occur simply from my constant close observation of the moving averages. The patterns and overall movement of moving averages (throughout all time frames)TELL A STORY.
Only saying that because I’m not the best trader in any way, shape or form, but it seems even the pros didn’t see it coming
RIPPER SpyderCall OP : Yep, I had a couple of BIG bangers today.
It’s a good idea right now, to sort through the tickers with the most meat on the bone, lowest IV that appear to be topped out. Yes, most I’m looking at appear to be completely topped out.
If my original theory is correct, and this is the initial stage of transitioning from bull run to bear, then we are about to have some of the best opportunities of the entire quarter.
SpyderCall OP RIPPER : Good call. today was ugly. How low do you think it will go before the market buys it back up?
RIPPER SpyderCall OP : The difference between this time and other recent falls? Breaking the trendlines!
I have been watching semiconductors closely as the daily/weekly chart of semiconductor sector appears to finally be topping out. This was helpful to confirm my suspicions of AMD/ NVDA and such topping out.
To answer your question not sure if I want to take a shot at it haha …. After the initial falls I would expect a small dead cat bounce INTO A BEAR FLAG, making many think the downside was just a small pullback, only to fall further soon after.
RIPPER SpyderCall OP : Join the chat more often, we need more opinions/ ideas!
SpyderCall OP RIPPER : That sounds about right to me.
SpyderCall OP RIPPER : I'm still waiting to put myself. I want to see how the week closes out first. I might consider puts tomorrow. Not sure yet.
SpyderCall OP RIPPER : I will for sure. I have just been so busy lately. I barely have enough time to post comments in my own chat room. But I will make an effort for sure
View more comments...