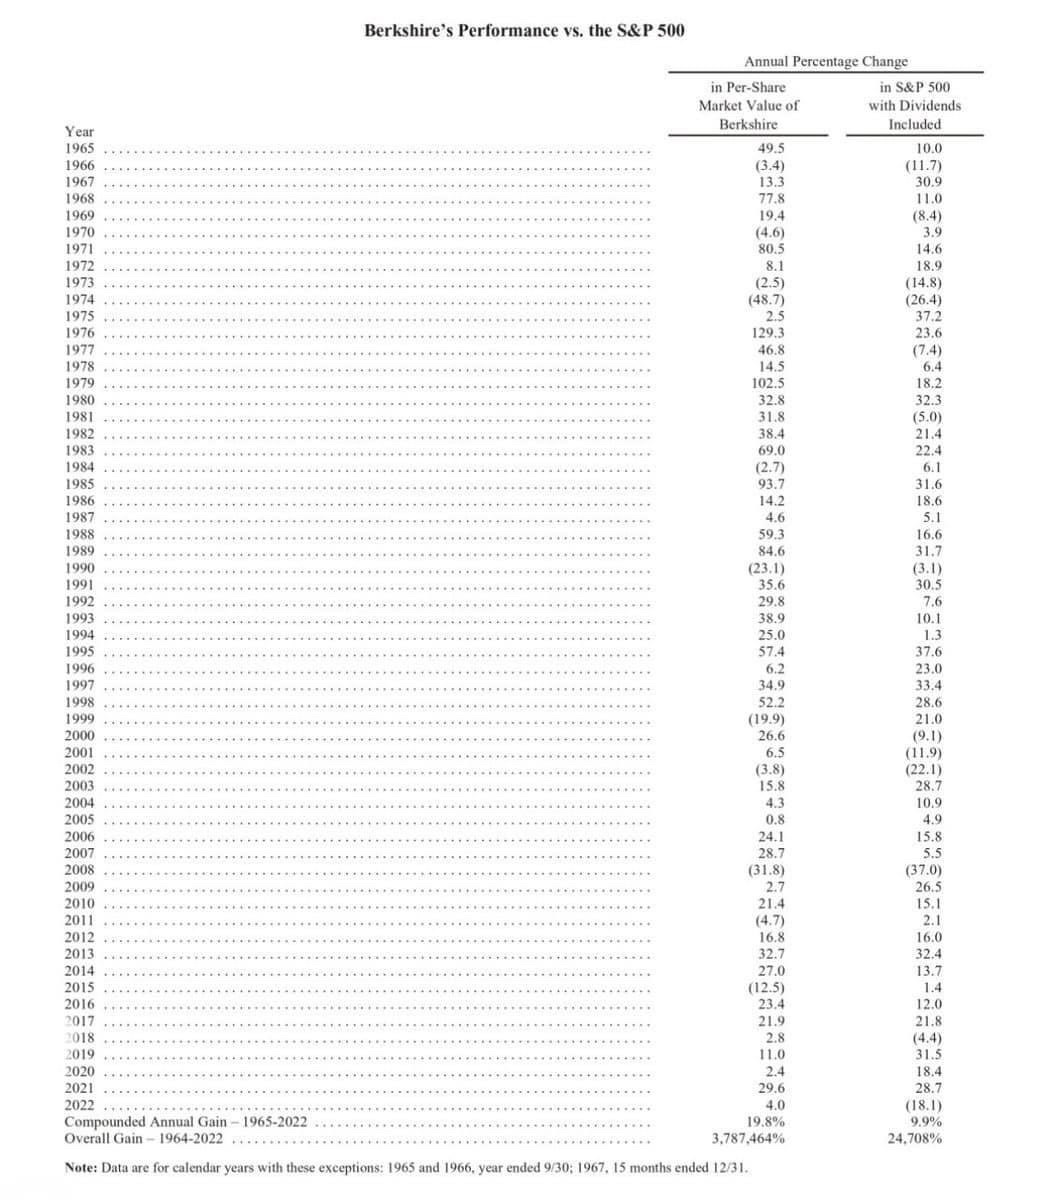
The image below shows the performance of Warren Buffett’s Berkshire Hathaway vs the S&P 500 each year from 1965 to 2022.
During this time period, there were 19 different years where Berkshire Hathaway underperformed the S&P 500.
In fact, there was even a period (2003-2005) where Berkshire underperformed the S&P 500 for 3 years in a row!
But here’s what’s so eye opening about this:
Here’s the compounded annual gain from each of these over this time period:
S&P 500: 9.9%
Berkshire Hathaway: 19.8%
That’s a massive difference.
But to put it into even more perspective, let’s look at the overall gain during this time period:
S&P 500: 24,708%
Berkshire Hathaway: 3,787,464%
Yes, I typed that correctly.
Despite underperforming the market 19 different times from 1965 to 2022, Berkshire’s returns were 3,787,464%, while the S&P 500 returned 24,708%.
Wow.

Disclaimer: Community is offered by Moomoo Technologies Inc. and is for educational purposes only.
Read more
Comment
Sign in to post a comment
