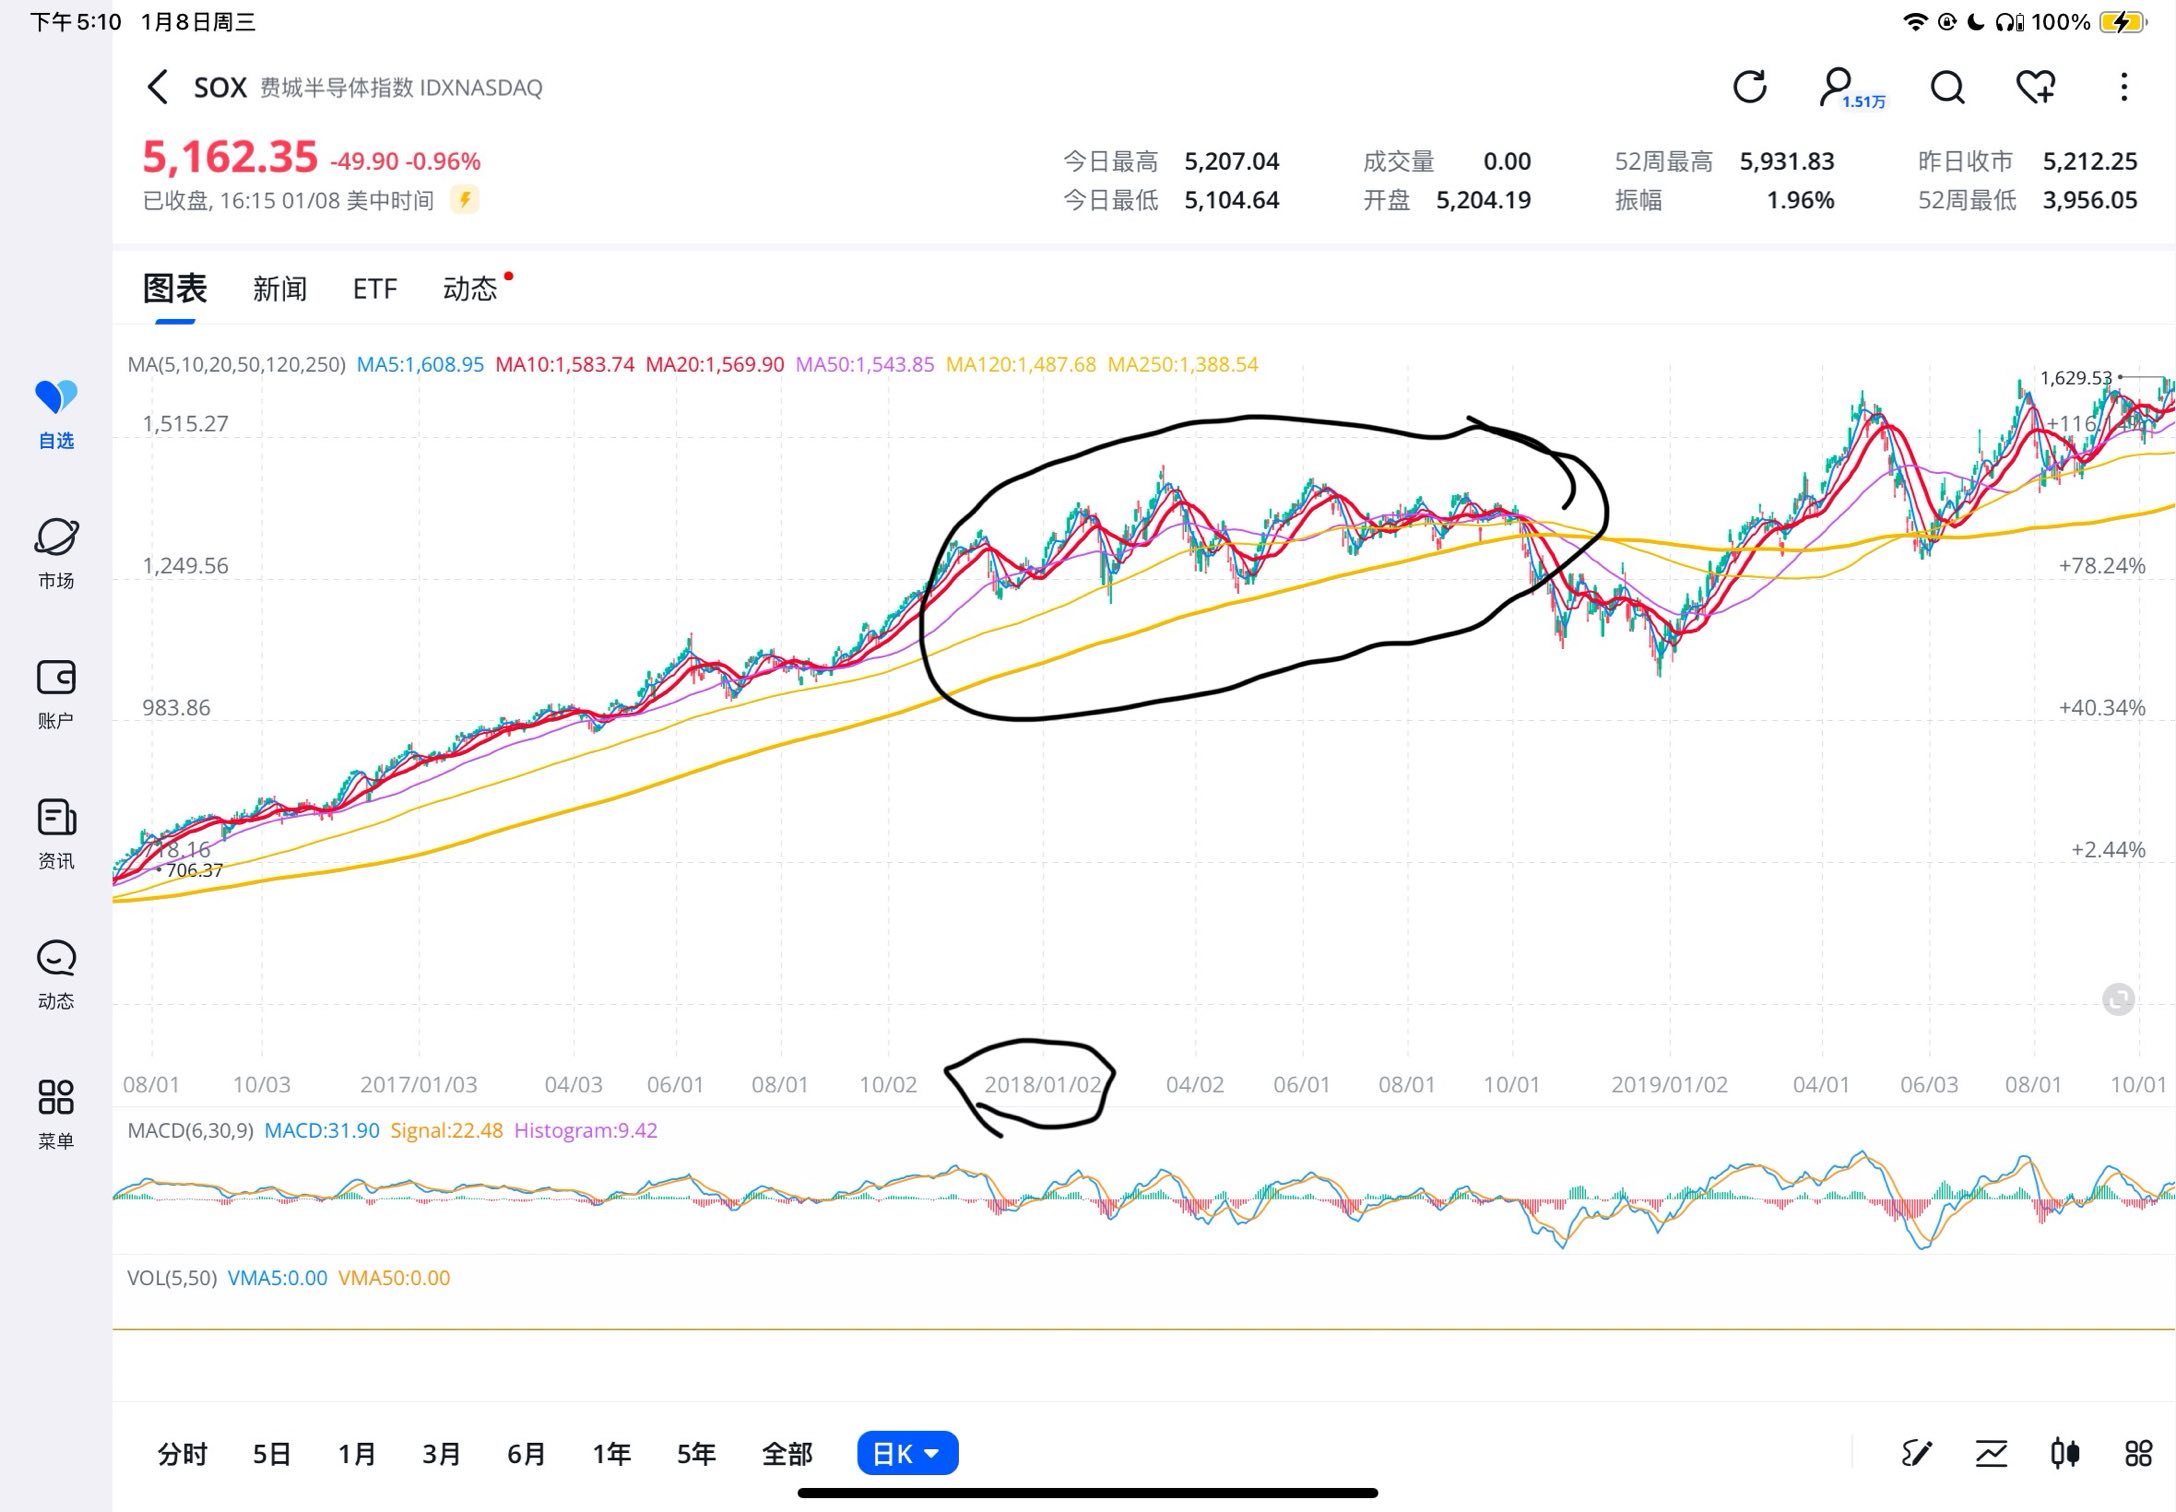
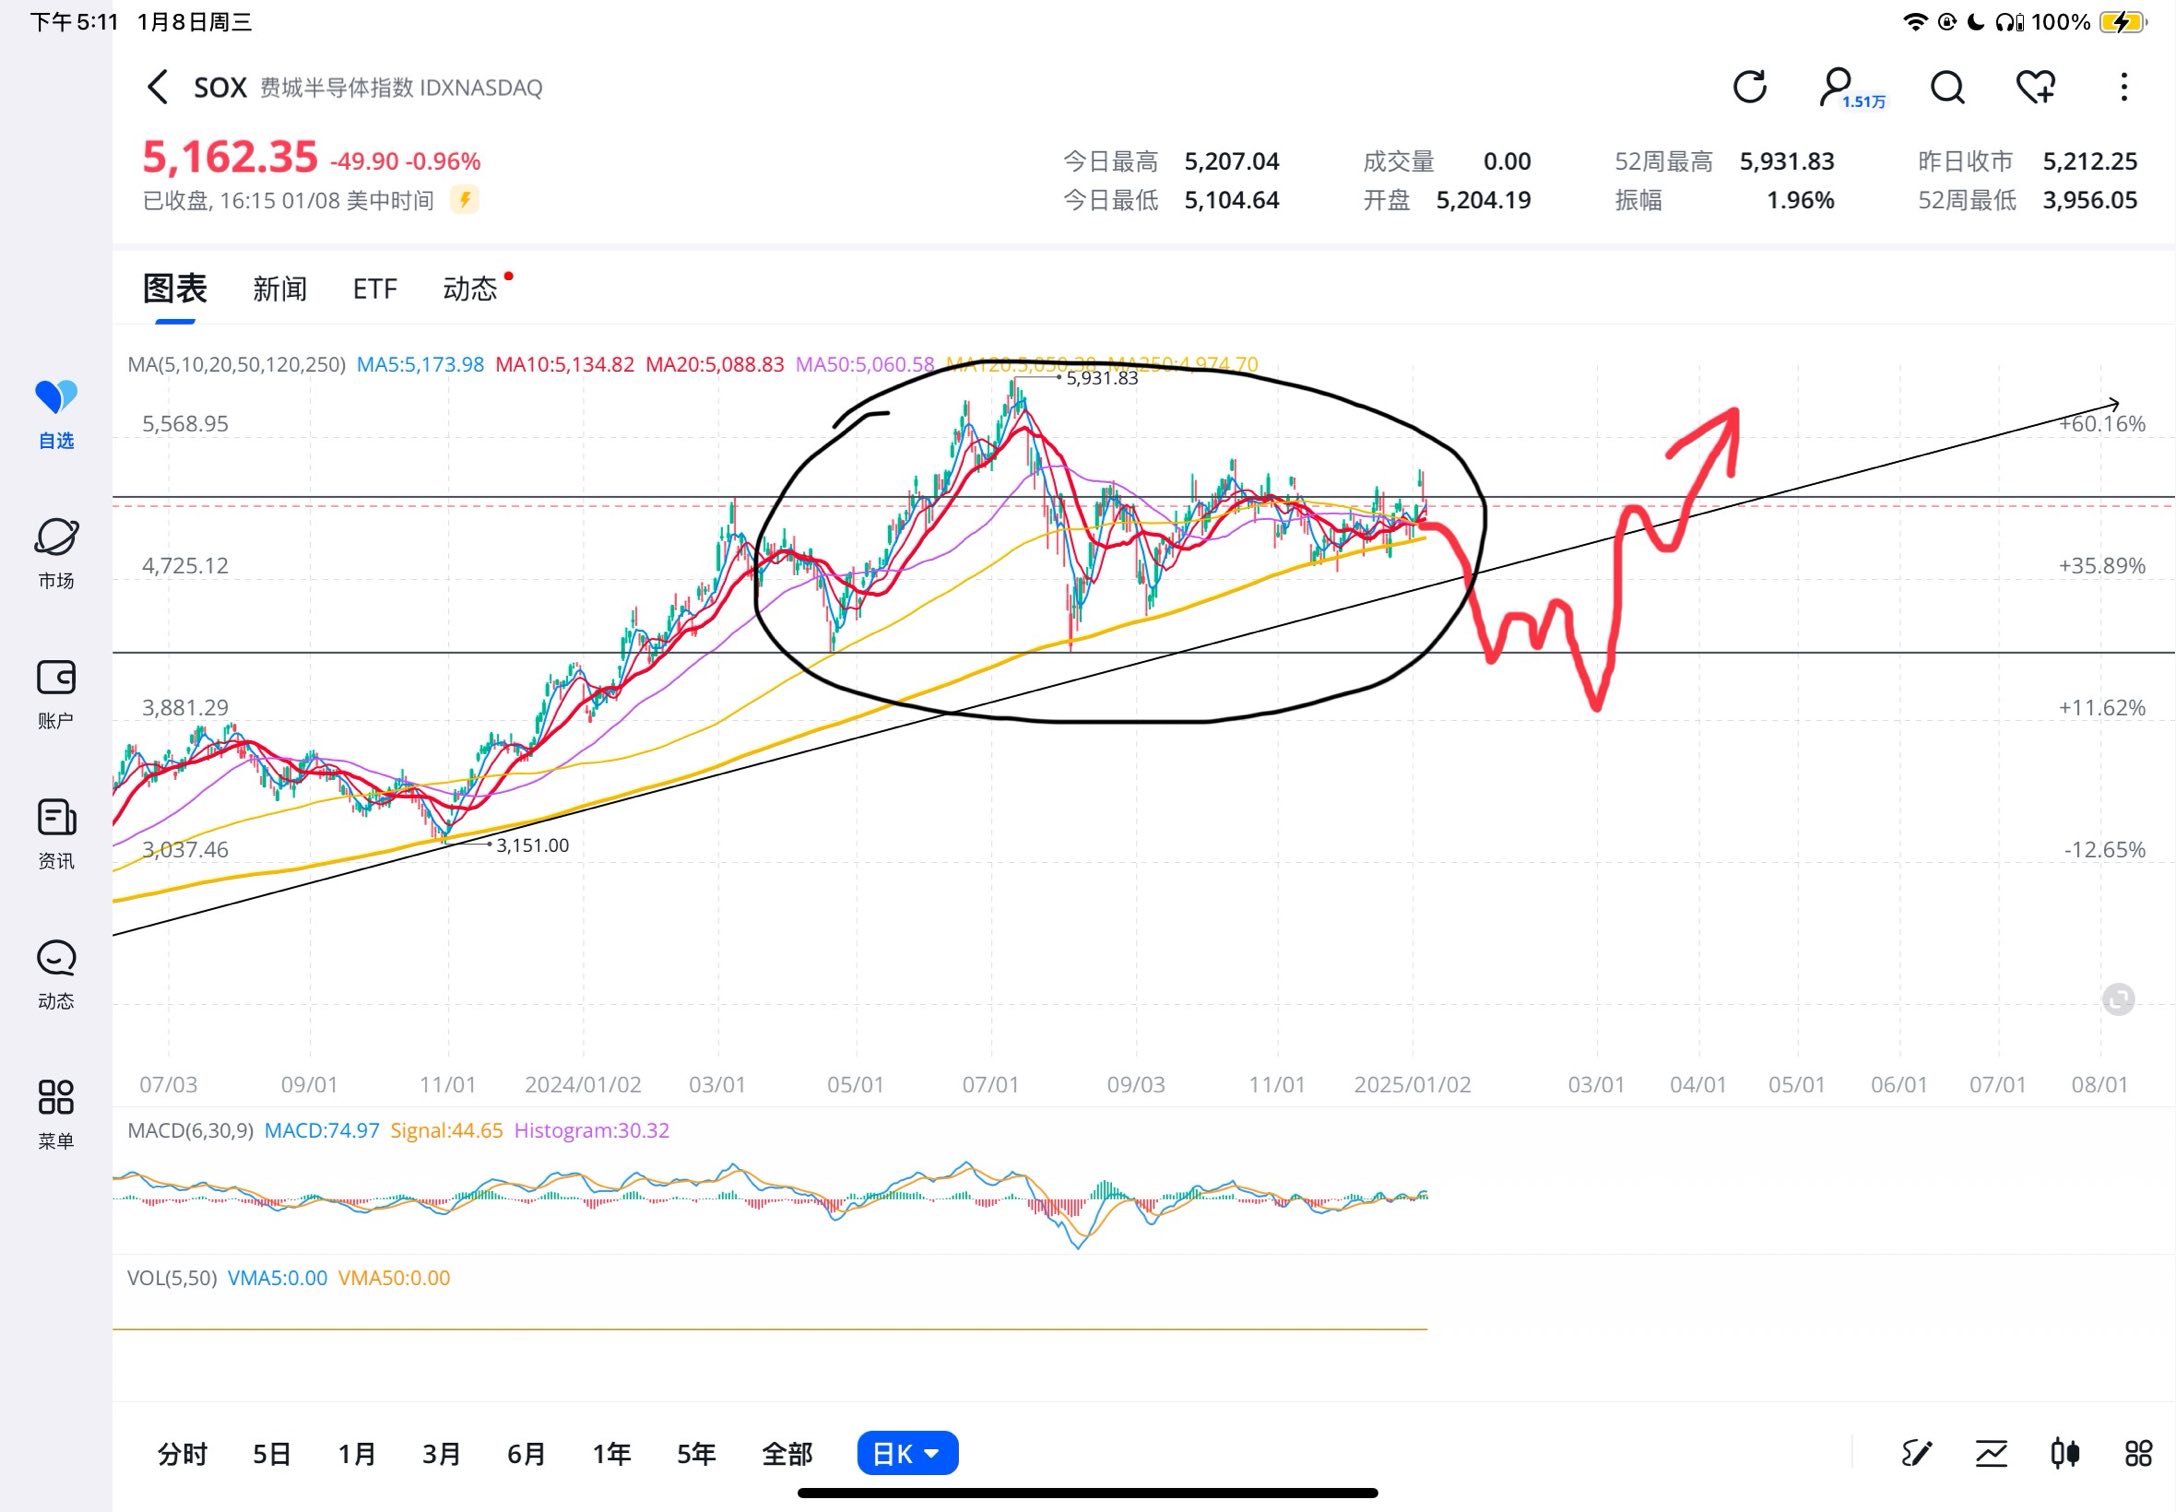
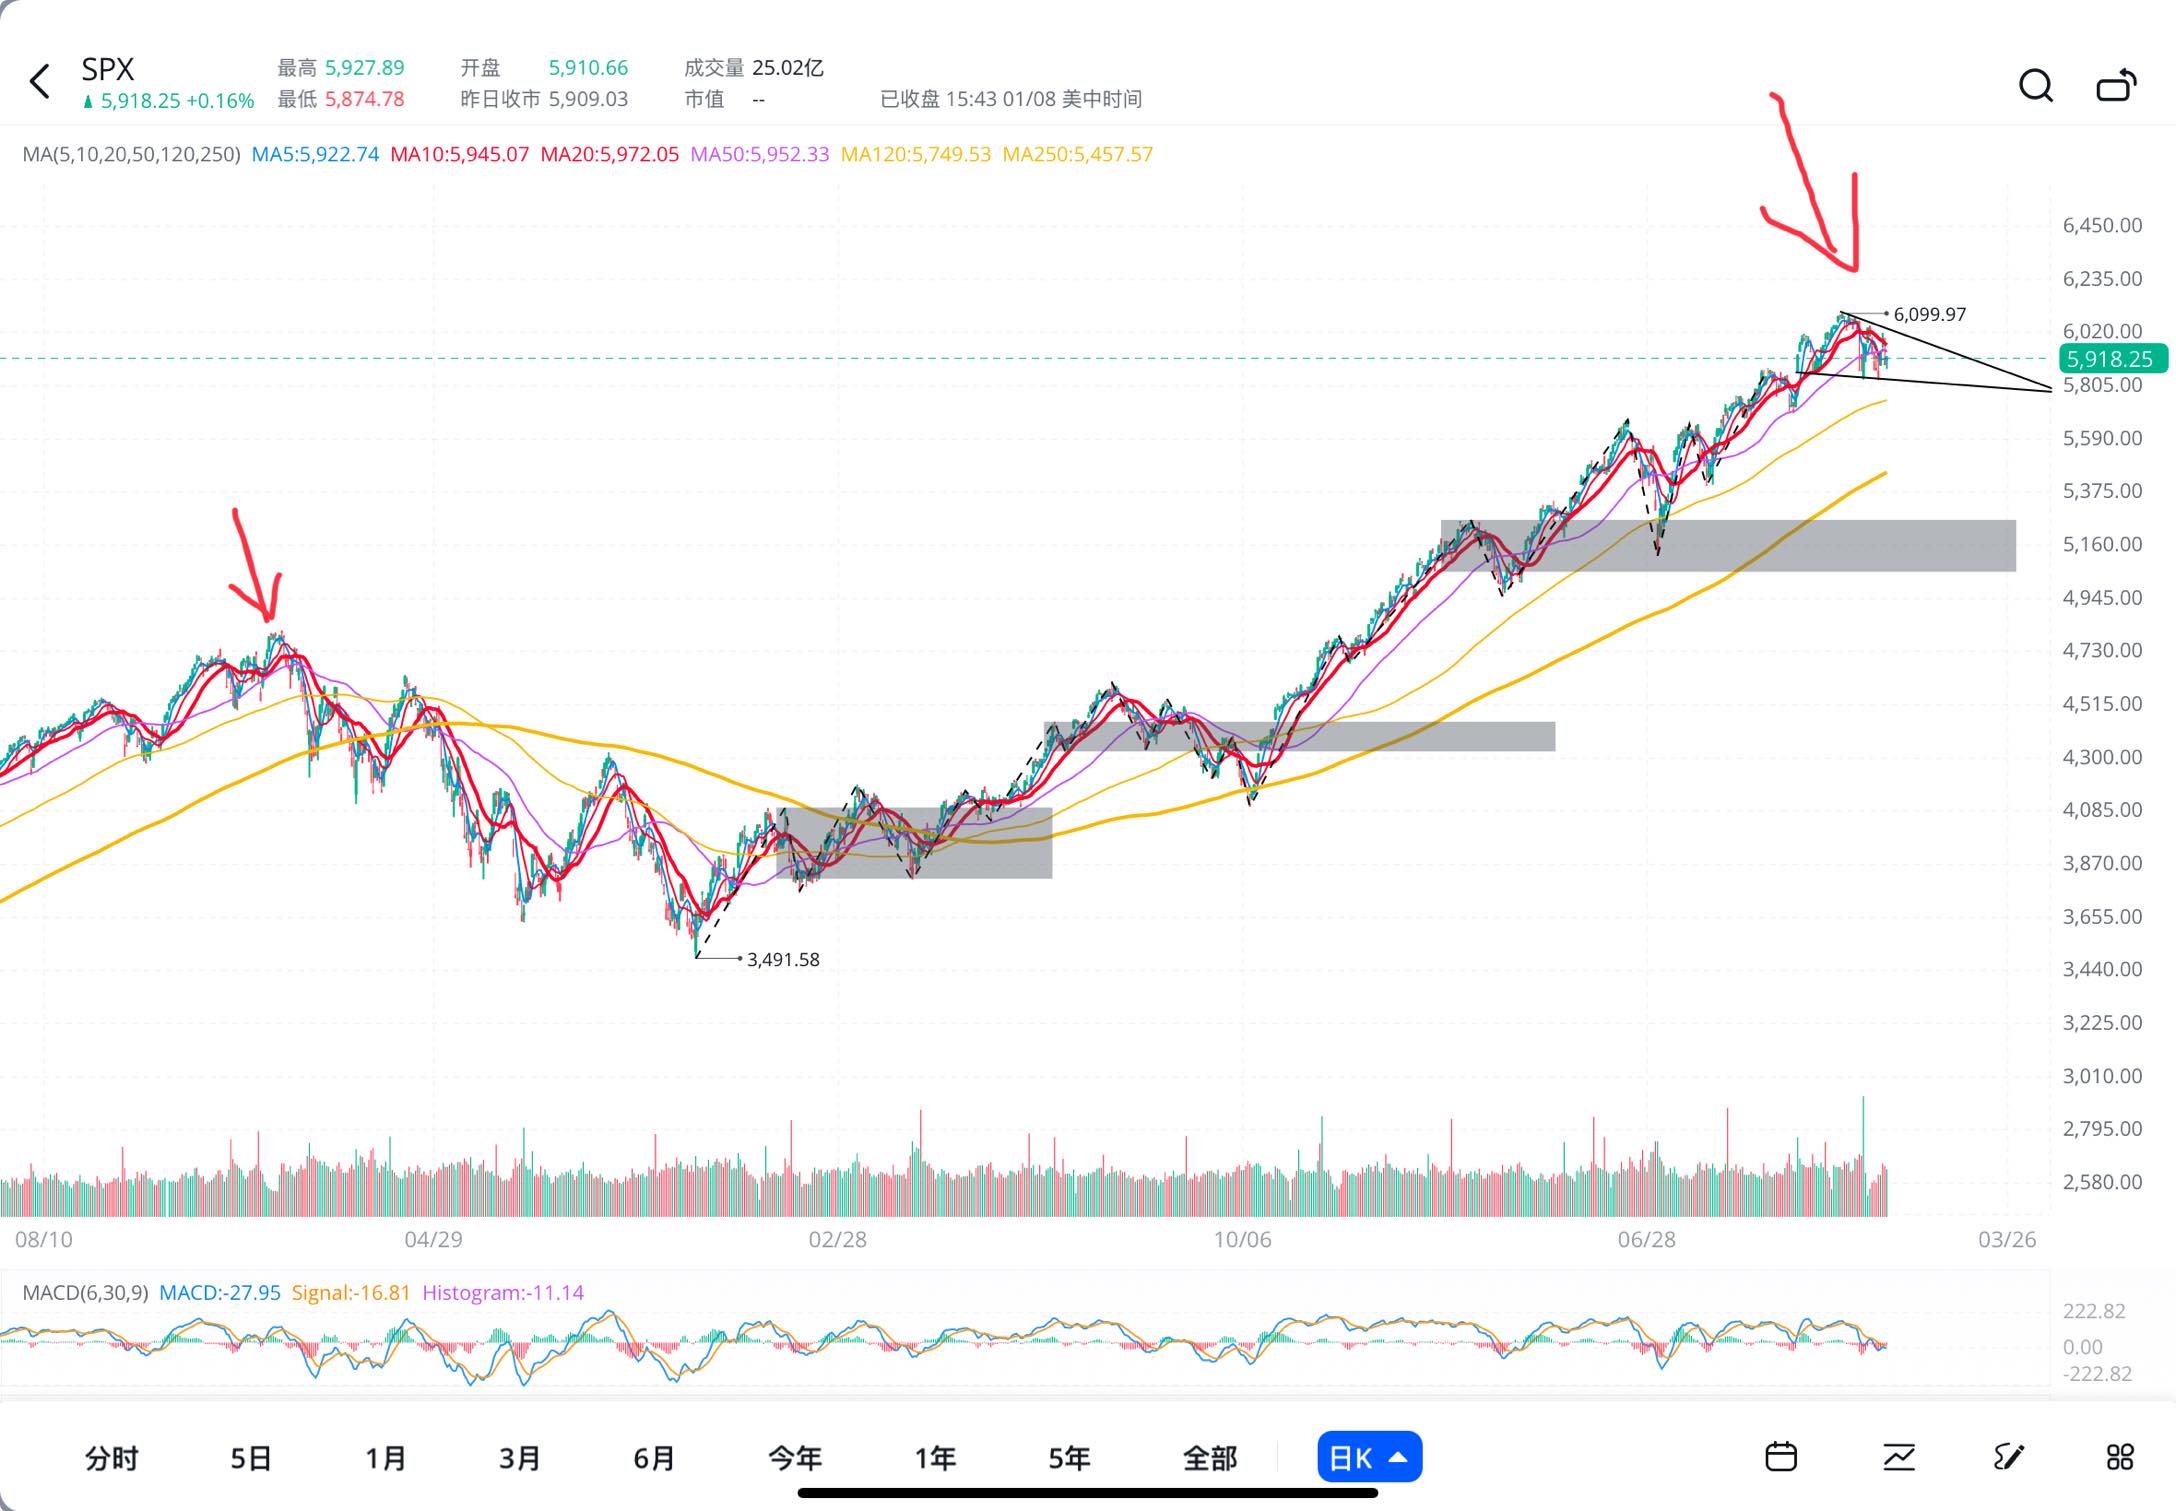
Large Cap is about to experience a significant decline, with historical technical patterns highly similar.


The historical trend is very similar to today, and a significant decline could occur at any time in the next two weeks!
Especially now, the technical pattern of the index (Chart 2) is highly similar to the technical pattern before the significant decline in October 2018 (Chart 1)!!! Both are consolidating near the 120-day moving average and 250-day moving average before a rapid decline, with these two moving averages currently in the process of forming a death cross.
The current technical pattern of the S&P Large Cap is also not good, as indicated by the arrows in Figure 3 highlighting the high similarity between the current and historical patterns.
Disclaimer: Community is offered by Moomoo Technologies Inc. and is for educational purposes only.
Read more
Comment
Sign in to post a comment

玄学炒股的美股韭菜 : Thank you
JFL :

