English
Back
Download
Log in to access Online Inquiry
Back to the Top
Ethereum ETFs set to trade: Will it spark the next crypto wave?
Views 617K Contents 41

The Market (SPY Significant Zone Level)

Good morning, good morning, gooooood morning everyone! My name is Alkaline, and welcome back to The Market!
First and foremost, I have to apologize once again for the lack of articles this week and the previous week. Between the IT outage, personal events, and work related assignments; I have not had the time to write an article the way that I want to. However, I have some free time this morning and so lets go over the charts and Market news!
Before we begin, I want to thank you all for the support on my previous article. We gained a lot of new followers and if you haven't had a chance to read it, you can check it out here
I will be looking into creating a Chatroom for all the followers and once the feature becomes released! There I will be sharing my charts, my levels, and some possible trades! However it will mostly be resourced based. There are plenty of traders out there who are far better than I am, so together we will teach and learn from eachother. I am excited for this next chapter for the Followers!
Now let us get into the topics of this article.
Todays Topics
Section 1: NEWS
Section 2: Ethereum Charts
Section 3: SPY Charts
Section 1: NEWS
- Joe Biden to withdraw from the 2024 Presidental Election Race
[Markets initial reaction was bearish]
- Kamal Harris to join the 2024 Presidental Election Race
[Markets initial reaction was bullish]
- Kamala and Donald Trump potentially to speak at the Bitcoin Conference
[No larger movement in crypto markets]
- Crowdstrike IT outage caused by an error in the code shut down railway systems, airport systems, biotech systems, and other key portions of infrastucture around the world
[Markets initial reaction was bearish, $CrowdStrike (CRWD.US)$ is down 20% since the outage]
- SEC approves 8 Spot Ethereum ETFs
Spot ETFs Currently Running:
Futures Currently Running:
Custodian:
Section 2: Ethereum Charts
I haven't charted Ethereum in a while, so let's take a look at where we are at and see if there is a possible setup to trade.
Ethereum Weekly
The Market (SPY Significant Zone Level)
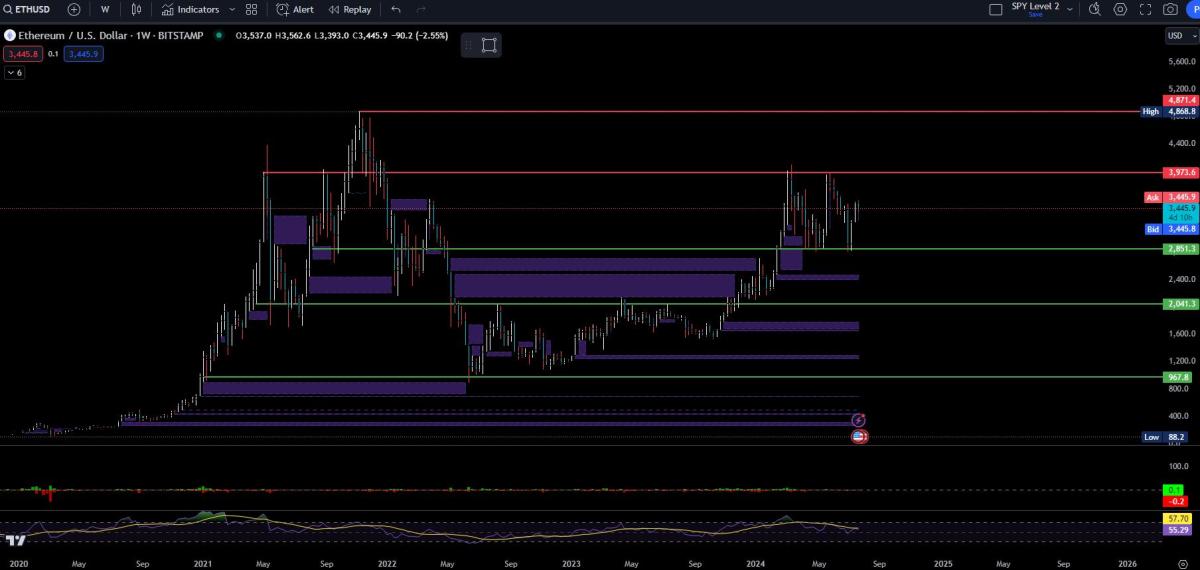
Right off the bat, I would say there is a possible Cup and Handle forming, however from the chart the handle portion seems to have mostly failed to play out. The likelyhood of more upside off the Cup and Handle structure is lower than if Ethereum would begin to form a new structure off of the current price action in the following weeks.
Weekly Levels:
$967.80
2,041.30
2,861.00
3,973.60
4,868.80
Ethereum Daily
The Market (SPY Significant Zone Level)
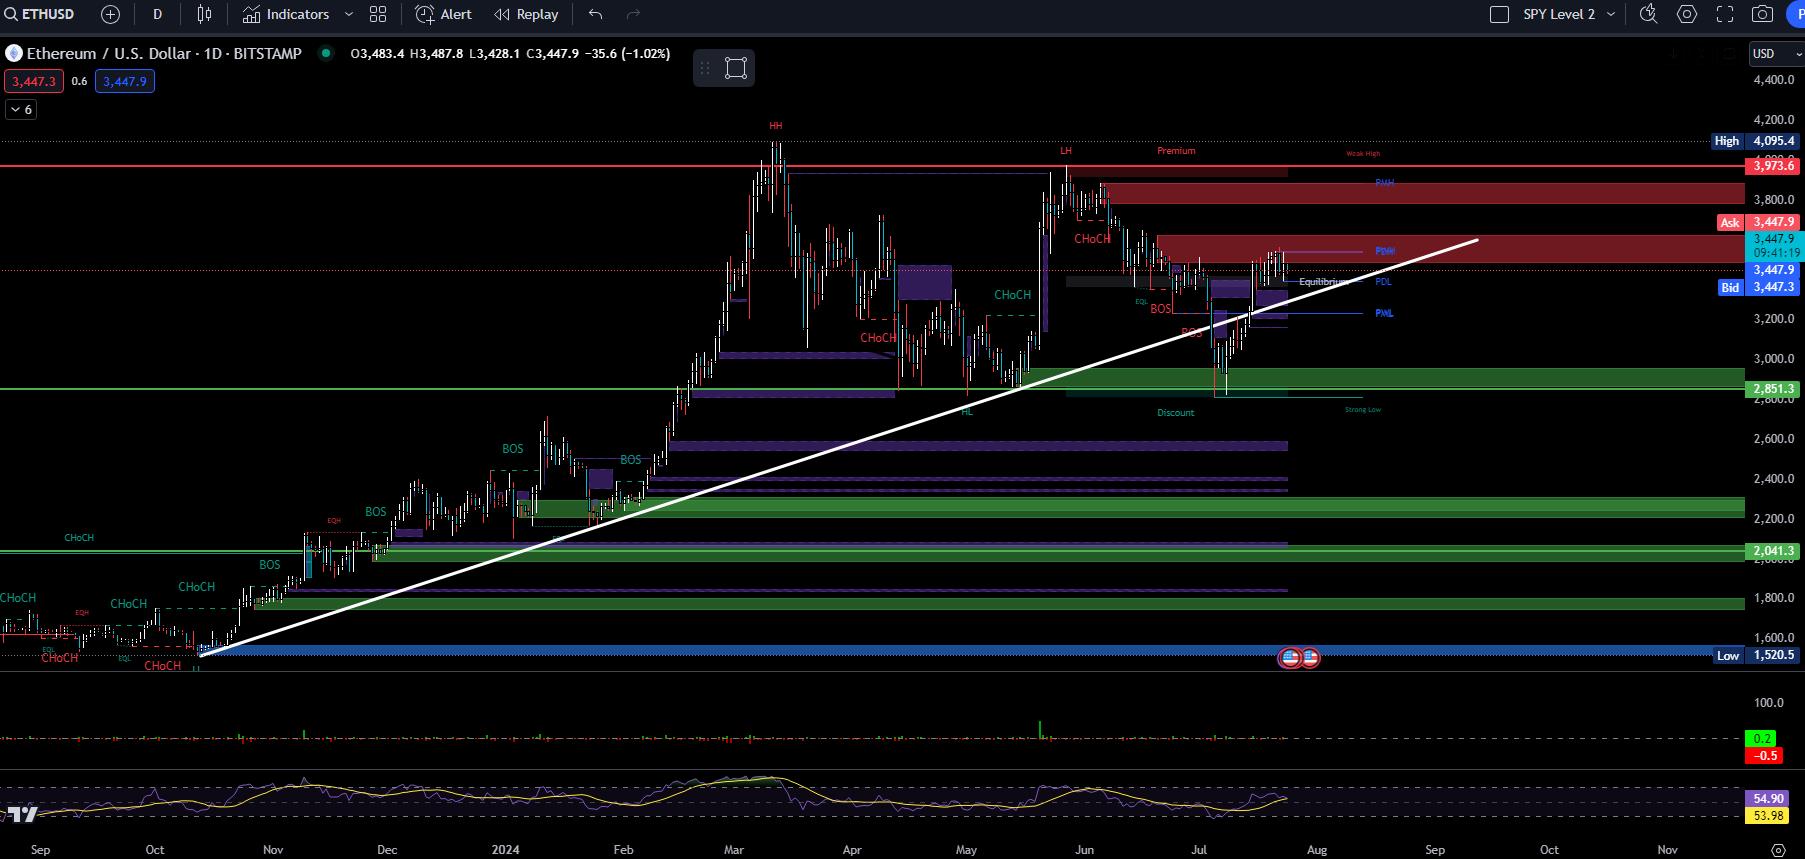
The Daily chart had an A- setup for more downside, but could not claim a retest and rejection off of the higher low trendlines. Buyers stepped up at the $2,900 range and took the price back to the highs where it is currently at an area of larger selling liquidity. Sellers will need more volume to move the price lower, however there is a lot of lingering buying liquidity should it try to retest the lows. They will need to push past this liquidity for another retest of the range.
Ethereum 4 Hour
The Market (SPY Significant Zone Level)
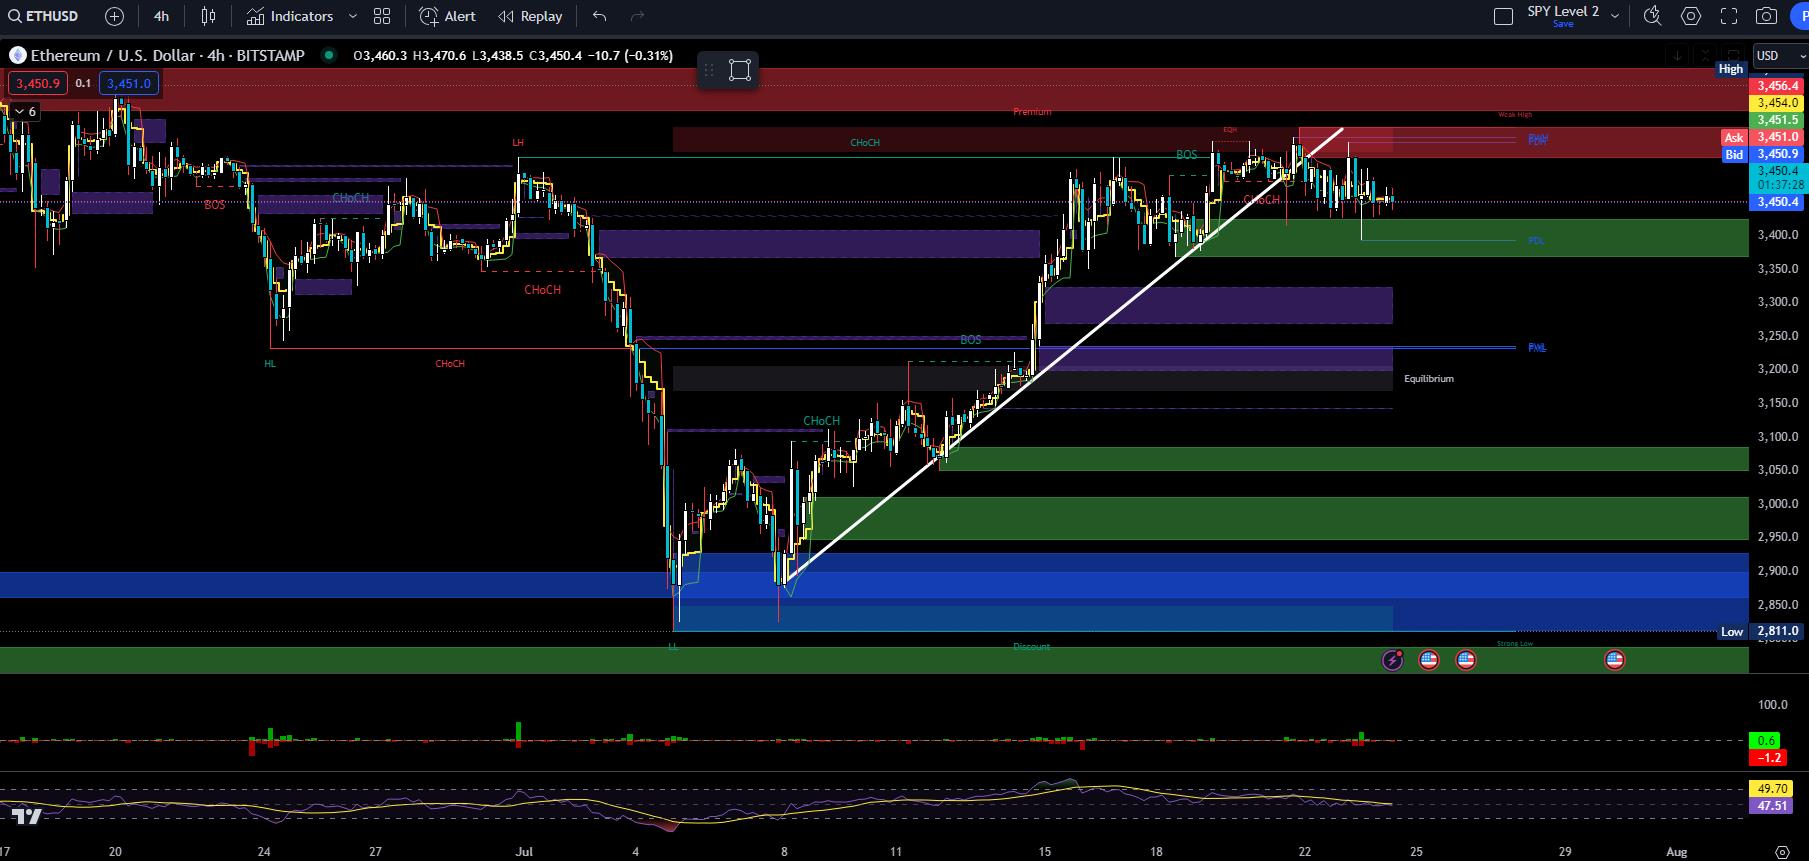
There is a ton of liquidity everywhere on the 4 hour as the price travels lower to the closest area at the $3,369.80 - $3,424.90 range. Other than that, there are no notable structures or price action here at the level. There was a previous imbalance move to the downside, met with buyers back to the upside. However, a larger move has yet to be realized.
Ethereum 1 Hour
The Market (SPY Significant Zone Level)
Again, no notable structures or price action here. Ethereum is currently in a battle between the buyers and sellers. Both the buyers and sellers will need more volume for a larger move in either direction. Once a move is made, the probability of it being a large move is higher than not.
Ethereum 15 Minute
The Market (SPY Significant Zone Level)
The 15 minute shows me extreme tight range volatility. As the battle between the buyers and sellers rages on, the price continues to move considerably sideways. Buyers and sellers will need more volume for a larger move out of the range.
Ethereum 5 Minute
The Market (SPY Significant Zone Level)
There are no notable structures or patterns forming on the 5 Minute. The battle between the buyers and sellers continues with the sellers in control for now.
Ethereum 1 Minute
The Market (SPY Significant Zone Level)
No chart is ever boring, however Etherum is failing to attract my interest as a buyer or a seller. I won't be taking a trade due to the lack of direction at the current range. Once the price breaks out to either side I will consider a position, however the 1 Minute shows me absolutely nothing. Be careful taking a position in Ethereum until either the buyers or sellers begin to show more strength.
Section 3: SPY Charts
SPY Daily
The Market (SPY Significant Zone Level)
The SPY is in a very key area. Since late 2023, the SPY has been in an enormous uptrend with a few retests to the downside where buyers stepped up to continue more upside. However, the trend has now tighened up leading us to a possible change in trend zone.
The Market (SPY Significant Zone Level)
Hardly cooincidentally, there are buyers at the possible first drop / change of direction zone at the $542.54 - $545.17 range. For specificity, the K Means cluster zone is showing $543.65 and $542.84 as prices of strong bullish resistance. That would be near the bottom of the liquidity, which I may take a trade based off of the candle action to the level. I am specifically looking for a sweep candle and rejection off the level preferably tomorrow. If the move happens today before power hour, I am less interested in a buying position.
SPY 4 Hour
The Market (SPY Significant Zone Level)
The 4 Hour is currently forming a sharp change of direction to the lows which might not be sustainable. Buyers want to see the price reach the significant Daily levels, reject off of them, and close above the trendline for a possible balancing in the price (sideways). If the buyers lose the tape as a result of news or a possible tech sell off, we might be looking at the beginning of more downside movement.
The Market (SPY Significant Zone Level)
Should the sellers ramp up, the next level of support from the Weekly time frame is the $532.65 level. That would be a significant drop from the current price we are at, but one that the SPY has made before.
They say to not fight the trend, however I cannot tell at this price whether puts or calls would be the better option. What I do think is if we can close above the significant levels today, we could see a rejection for more balancing tomorrow. However, if we close below the levels today I would not be considering calls and would instead focus on an ideal level for a short position.
SPY 1 Hour
The Market (SPY Significant Zone Level)
There is currently a large Fair Value Gap on the 1 hour which might play nicely in favor of the bulls if the buyers can find support. However, I would not hold a buying position in case the gap does not get filled with notable volume. This is a common technique to notice potential squeeze candles which could liquidate portfolios if you are not careful. I am eyeing Reversal O'Clock for this Swing / Day trade.
SPY 15 Minute
The Market (SPY Significant Zone Level)
Almost every time frame, other than the 1 Hour, suggests that the price is currently in an area of buying liquidity. With the FVG, this gives me more confidence of a possible reversal on the day. However, I cannot say for certain if we will reverse on the day, or if we will swing into a reversal tomorrow.
SPY 5 Minute
The Market (SPY Significant Zone Level)
The 5 Minute shows us a huge sell down from the previous close yesterday. This move is probably attributed towards Tesla's earnings which were mixed to the bear side. However, given the levels we are at, I think the SPY will see another push to the upside back into the range before a possible retest off of the upper levels.
SPY 1 Minute
The Market (SPY Significant Zone Level)
There is a 9 and 20 EMA cross over on the 1 minute into some selling liquidity. If the buyers can hold and enter with a bit more volume, they could squeeze these sellers to potentially aim for the Fair Value Gap on the 1 Hour. I will be paying close attention to the candles and if we can get into the Fair Value Gap, I think that would be a more ideal place to look for a put swing position, but the buyers must first reach the Fair Value Gap on the 1 hour time frame.
Conclusion
Thank you all so much for reading and again, I apologize for the lack of articles this week and the last week. We are getting very close to 1,500 Followers and I am bullish on achieving that goal by the end of Q4!
With that said, I hope you all enjoy your week in the Market and if I have the time to write an article, I will do so each day that it is possible. Thank you once again, and I hope you all make some money
Disclaimer: Community is offered by Moomoo Technologies Inc. and is for educational purposes only. Read more
18
1
+0
1
Translate
Report
272K Views
Comment
Sign in to post a comment
avatar
Moo Contributor
Alkaline Analyst All Deep Dives: https://medium.com/@alkalinedeepdives
1693Followers
8Following
5284Visitors
Follow