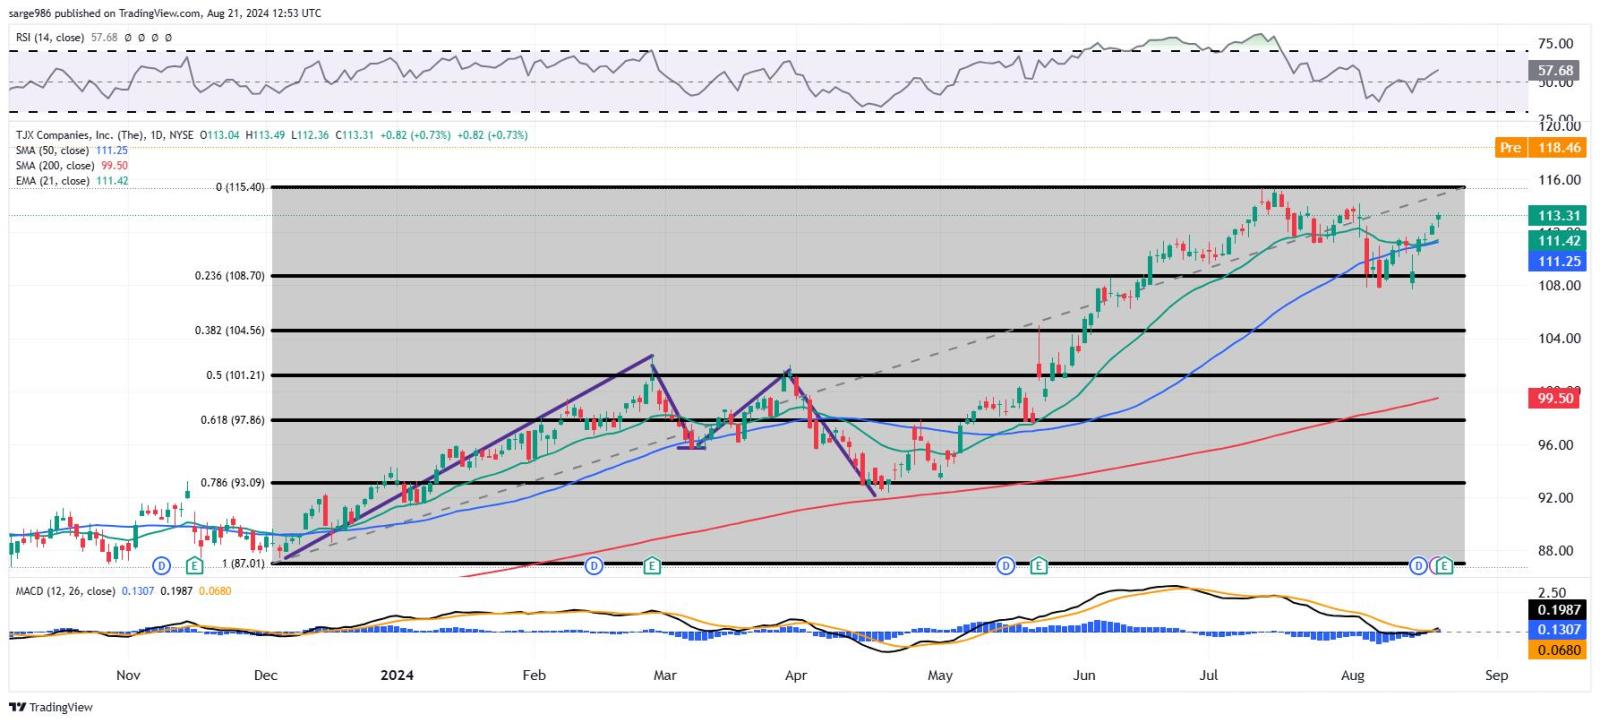
TJX Chart
...
$TJX Companies (TJX.US)$ .. Readers will see that TJX went through a double top reversal earlier this year, which worked less well that someone using that downside pivot to set a target probably would have liked. Going back to the liftoff in late 2023, the stock peaked at $115 in July. Over the next month and change, TJX went through a basing period of consolidation making use of the 23.5% Fibonacci retracement level of that late '23 into July '24 rally as support. TJX is likely to at least try to break out of that basing period this morning, making use of that July apex as a pivot. I am long this stock.
Disclaimer: Community is offered by Moomoo Technologies Inc. and is for educational purposes only.
Read more 6
6