$Alibaba Group Holding Ltd(BABA.US)$ is down over 40% from its October 2020 all-time high of $319.32. China-based stocks have taken a beating from the Chinese government, which continues to crack down on companies trading on U.S. exchanges, and worsening U.S./China relations has rubbed salt on the wounds.
On Tuesday U.S. Defense Secretary Lloyd Austin, in a speech from Singapore, said the U.S. is committed to having a constructive relationship with China. There’s hope Austin’s comment will act as a starting point for the two countries to begin mending tensions.
The Alibaba Chart: Alibaba’s steep and drastic sell-off may have culminated on Tuesday when the stock printed the final candle of a Sanku pattern.
The Sanku reversal pattern consists of three gaps, in either direction, which exhausts either the bulls or the bears and marks the point where the stock price reverses. Alibaba’s stock gapped down on Friday, Monday and Tuesday and subsequent price action failed to fill any of the gaps.
Alibaba also printed a bullish green hammer candlestick. This candlestick, especially at the bottom of a Sanku pattern, adds to the bullish thesis a reversal is imminent.
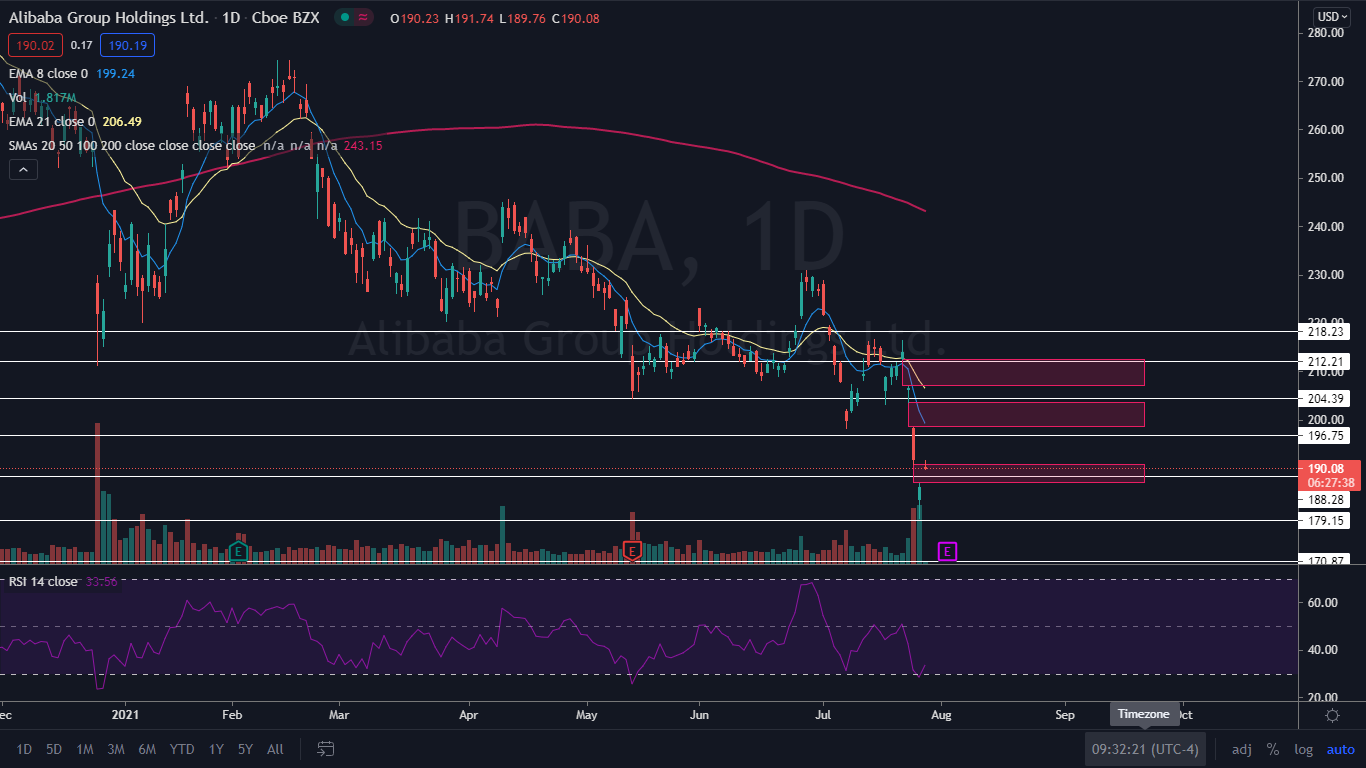
Alibaba’s relative strength index (RSI) fell below 30% on Tuesday, which also indicates a bounce is in the cards. When Alibaba’s RSI fell below 30% on May 13, the stock bounced up 6.24% over the following five days.
The stock is trading well below both the eight-day and 21-day exponential moving averages with the eight-day EMA trending below the 21-day EMA, both of which are bearish indicators. Alibaba is also trading down almost 25% below the 200-day simple moving average which indicates overall sentiment in the stock is bearish. Because Alibaba is too extended from the three moving averages, a bounce is likely needed to allow at least the eight-day EMA to catch up.
Bulls want to see the Sanku reversal pattern recognized and for Alibaba’s stock to bounce up and regain support at $196. Above the level it has further resistance at $204 and $212.
Bears want to see big bearish volume continue to pressure Alibaba’s stock to the downside. If the stock loses support at $188, it could fall toward $179 again before bouncing.