ECRI Weekly Leading Index Update
ECRI Weekly Leading Index Update
Summary
摘要
By Jill Mislinski
吉尔·米斯林斯基(Jill Mislinski)著
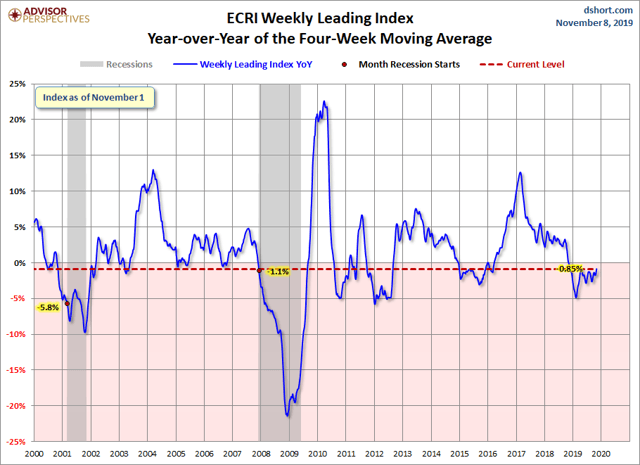
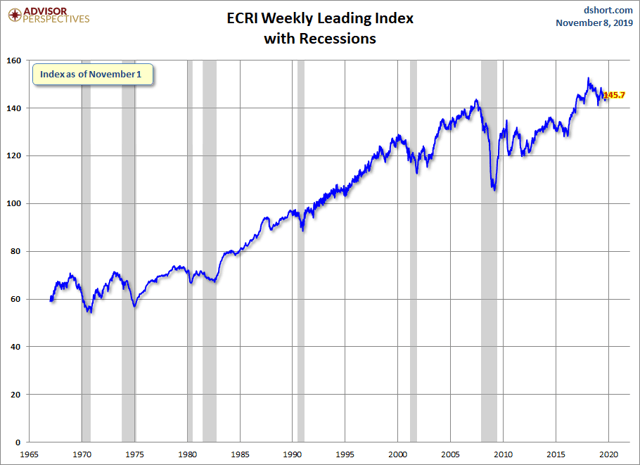
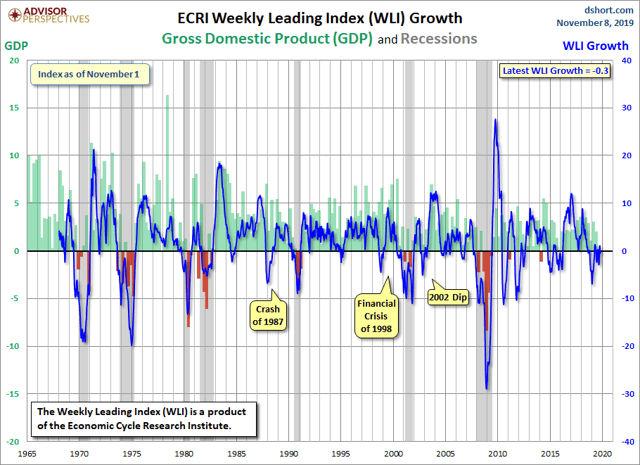
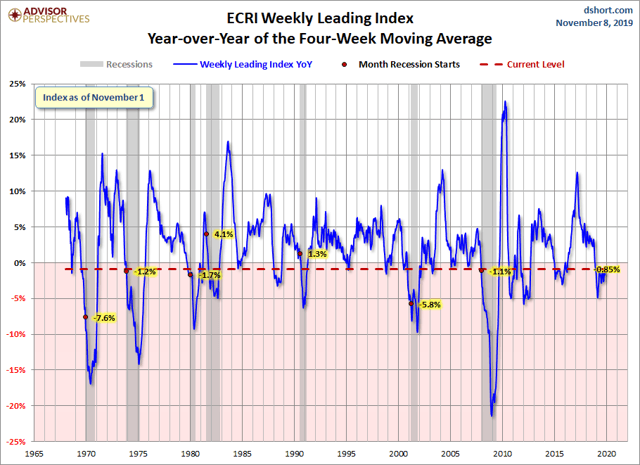
This Nov. 8 morning's release of the publicly available data from ECRI puts its Weekly Leading Index (WLI) at 145.7, up 0.5 from the previous week. Year-over-year, the four-week moving average of the indicator is now at -0.85%, up from last week. The WLI Growth indicator is now at -0.31, up from the previous week.
11月8日上午,ECRI公布的公开数据显示,其每周领先指数(WLI)为145.7,比前一周上升了0.5%。与上年同期相比,该指标的四周移动均值目前位于-0.85%,高于上周的水平。WLI增长指标目前为-0.31,高于前一周。
The ECRI Indicator Year-over-Year
ECRI指标同比
Below is a chart of ECRI's smoothed year-over-year percent change since 2000 of their weekly leading index. The latest level is above where it was at the start of the last recession.
以下是ECRI自2000年以来每周领先指数平稳的同比百分比变化图表。最新水平高于上次衰退开始时的水平。
Appendix: A Closer Look at the ECRI Index
附录:详细了解ECRI指数
The first chart below shows the history of the Weekly Leading Index and highlights its current level.
下面的第一张图表显示了周度领先指数的历史,并突出显示了其当前水平。
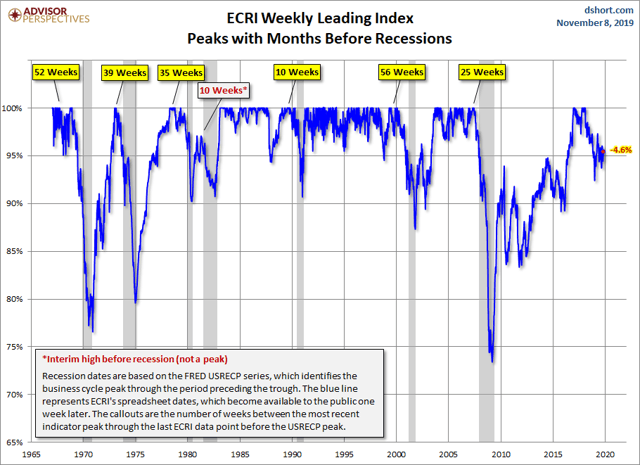
For a better understanding of the relationship of the WLI level to recessions, the next chart shows the data series in terms of the percent-off the previous peak. In other words, new weekly highs register at 100%, with subsequent declines plotted accordingly.
为了更好地理解WLI水平与衰退的关系,下一张图表显示了从前一个峰值下降的百分比的数据系列。换言之,周线新高为100%,随后的下跌趋势也相应出现。
As the chart above illustrates, only once has a recession ended without the index level achieving a new high - the two recessions, commonly referred to as a "double-dip," in the early 1980s. We've exceeded the previously longest stretch between highs, which was from February 1973 to April 1978. But the index level rose steadily from the trough at the end of the 1973-1975 recession to reach its new high in 1978. The pattern in ECRI's indicator is quite different, and this has no doubt been a key factor in their business cycle analysis.
正如上图所示,只有一次衰退结束后,指数水平没有达到新高--20世纪80年代初的两次衰退,也就是通常所说的“二次探底”。我们已经超过了之前高点之间最长的一段时间,也就是1973年2月到1978年4月。但该指数水平从1973-1975年经济衰退结束时的低谷稳步上升,并在1978年达到新高。ECRI指标的模式非常不同,这无疑是他们进行商业周期分析的关键因素。
The WLIg Metric
WLIg指标
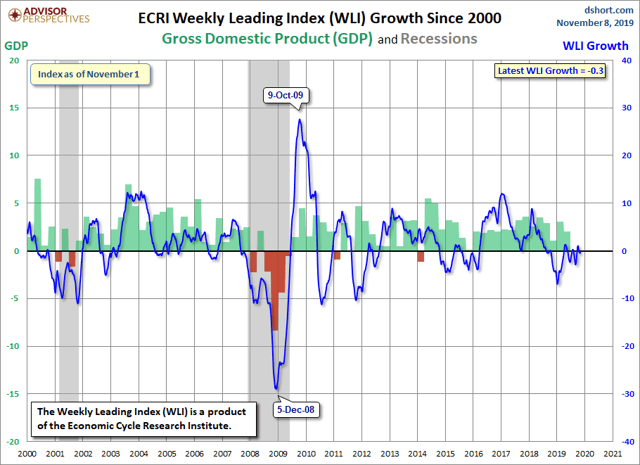
The best known of ECRI's indexes is their growth calculation on the WLI. For a close look at this index in recent months, here's a snapshot of the data since 2000.
ECRI最著名的指数是它们对WLI的增长计算。要仔细观察近几个月的这一指数,以下是自2000年以来的数据快照。
Now let's step back and examine the complete series available to the public, which dates from 1967. ECRI's WLIg metric has had a respectable record for forecasting recessions and rebounds therefrom. The next chart shows the correlation between the WLI, GDP, and recessions.
现在,让我们退后一步,看看公众可以看到的完整系列,这些系列可以追溯到1967年。ECRI的WLIg指标在预测经济衰退和从中反弹方面有着令人尊敬的记录。下一张图表显示了WLI、GDP和经济衰退之间的相关性。
Year-over-Year Growth in the WLI
WLI的同比增长
Here is a snapshot of the year-over-year growth of the WLI rather than ECRI's previously favored method of calculating the WLIg series from the underlying WLI (see the endnote below). Specifically, the chart immediately below is the year-over-year change in the 4-week moving average of the WLI. The red dots highlight the YoY value for the month when recessions began.
这里是WLI同比增长的快照,而不是ECRI之前青睐的根据基础WLI计算WLIg系列的方法(参见下面的尾注)。具体地说,紧随其后的图表是WLI四周移动平均线的同比变化。红点突出显示了衰退开始当月的YoY值。
The WLI YoY is now at -0.85%, up from last week. The latest level is higher than at the start of five of the last seven recessions.
WLI YoY指数目前为-0.85%,高于上周的水平。最新水平高于过去七次衰退中五次衰退开始时的水平。
Note: How to Calculate the Growth series from the Weekly Leading Index
注:如何从周度领先指数计算增长数列
ECRI's weekly Excel spreadsheet includes the WLI and the Growth series, but the latter is a series of values without the underlying calculations. After a collaborative effort by Franz Lischka, Georg Vrba, Dwaine van Vuuren and Kishor Bhatia to model the calculation, Georg discovered the actual formula in a 1999 article published by Anirvan Banerji, the Chief Research Officer at ECRI: "The three Ps: simple tools for monitoring economic cycles - pronounced, pervasive and persistent economic indicators."
ECRI每周的Excel电子表格包括WLI和增长系列,但后者是一系列没有基础计算的值。经过弗朗茨·利施卡、格奥尔格·维尔巴、德文·范·维伦和基肖尔·巴蒂亚的共同努力,格奥尔格在ECRI首席研究官阿尼尔万·班纳吉1999年发表的一篇文章中发现了实际的公式:三个P:监测经济周期的简单工具-明显的、普遍的和持久的经济指标."
Here is the formula:
以下是公式:
"MA1" = 4 week moving average of the WLI
"MA2" = moving average of MA1 over the preceding 52 weeks
"n"= 52/26.5
"m"= 100
WLIg = [m*(MA1/MA2)^n] - m
“MA1”=WLI的4周移动平均值
“MA2”=过去52周MA1的移动平均值
"n"= 52/26.5
"m"= 100
WLIg=[M*(MA1/MA2)^n] - m
Editor's Note: The summary bullets for this article were chosen by Seeking Alpha editors.
编者注:本文的摘要项目符号是由寻找Alpha编辑选择的。

