
A Look At The Stock Market Following Independence Day Holiday: The Bull, Bear Case
A Look At The Stock Market Following Independence Day Holiday: The Bull, Bear Case
The SPDR S&P 500 (NYSE:SPY) closed slightly higher on Monday on far below-average volume ahead of the Fourth of July holiday.
这个 SPDR 标准普尔 500 纽约证券交易所代码:SPY)周一收盘小幅上涨,在七月四日假期之前,成交量远低于平均水平。
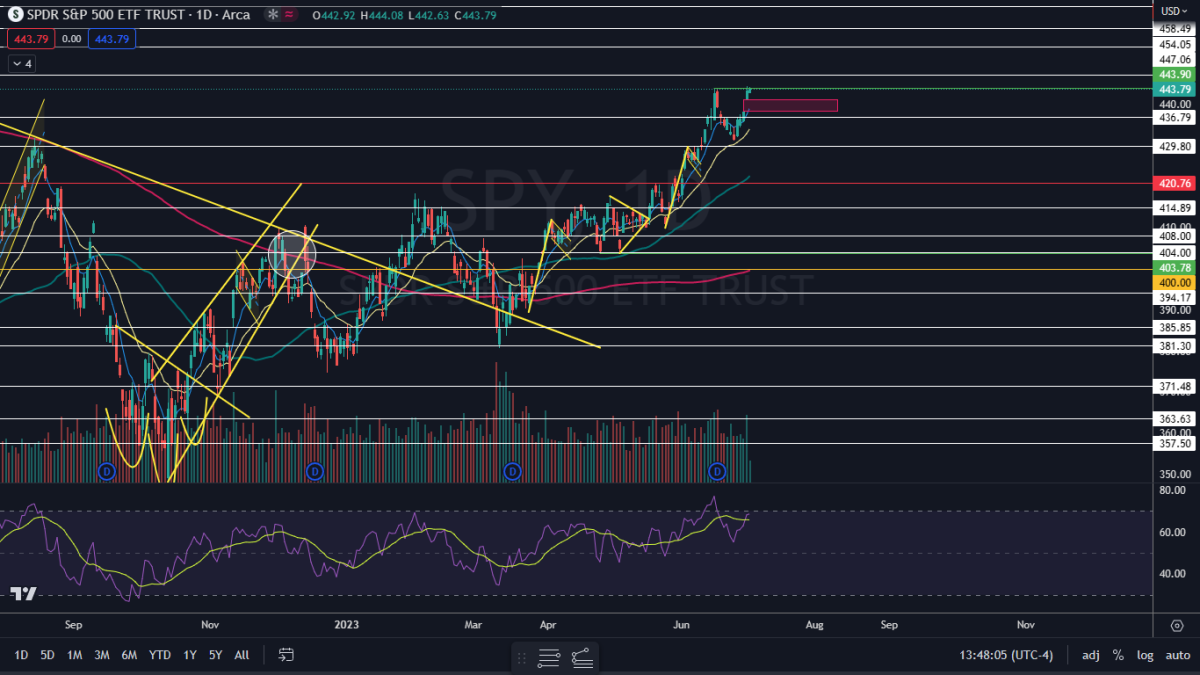
The stock market ETF printed an inside bar pattern on the daily chart, which leans bullish for continuation, although a bearish quadruple top pattern could cause resistance near the $444 level to hold strong.
股市ETF在日线图上出现了内条形图案,倾向于继续看涨,尽管看跌的四重顶形态可能会导致444美元附近的阻力位保持强劲。
More experienced traders who wish to play the SPY either bullishly or bearishly may choose to do so through one of two Direxion ETFs. Bullish traders can enter a short-term position in Direxion Daily S&P 500 Bull 3X Shares (NYSE: SPXL) and bearish traders can trade the inverse ETF, Direxion Daily S&P 500 Bear 3X Shares (NYSE:SPXS).
希望以看涨或看跌的方式玩SPY的经验更丰富的交易者可以选择通过两只Direxion ETF中的一只进行交易。看涨的交易者可以进入短期头寸 Direxion Daily 标准普尔500指数牛市3X股 纽约证券交易所股票代码:SPXL)和看跌交易者可以交易反向ETF, Direxion Daily 标准普尔500指数 Bear 3X (纽约证券交易所:SPXS)。
See Also: Bitcoin Consolidates Under Heavy Resistance, Prints Bullish Pattern: A Look At The Technicals
另见:比特币在强劲阻力下盘整,呈现看涨模式:技术面分析
The ETF: SPXL and SPXS are triple leveraged funds that track the movement of the SPY, seeking a return of 300% or negative 300% on the return of the benchmark index over a single day.
交易所买卖基金: SPXL和SPXS是追踪SPY走势的三重杠杆基金,他们寻求基准指数单日回报率为300%或负300%的回报。
It should be noted that leveraged ETFs are meant to be used as a trading vehicle as opposed to long-term investments.
应该注意的是,杠杆ETF旨在用作交易工具,而不是长期投资。
Want direct analysis? Find me in the BZ Pro lounge! Click here for a free trial.
想要直接分析?在 BZ Pro 休息室找我!点击此处免费试用。
The SPY Chart: The SPY's inside bar pattern leans bullish because the ETF was trading higher before forming it and because Monday's trading range took place near the top of Friday's range. Bullish traders want to see the ETF break up from the mother bar on higher-than-average volume on Wednesday, which will confirm the pattern was recognized.
间谍图表: SPY的内柱形态倾向于看涨,因为ETF在形成之前交易价格走高,也因为周一的交易区间在周五的区间顶部附近。看涨的交易者希望看到ETF在周三的交易量高于平均水平时从母柱上突破,这将证实这种模式已得到认可。
Bearish traders want to see big bearish volume come in near $444 again on Wednesday, which could suggest the quadruple top pattern is dominant or it could cause a quintuple top pattern to print. If that area continues to act as strong resistance, sideways consolidation or a retracement lower are likely.
看跌交易者希望看到周三再次出现大幅看跌交易量接近444美元,这可能表明四顶形态占主导地位,也可能导致出现五倍的顶部模式。如果该区域继续充当强阻力,则可能会横盘整或回撤走低。
The sideways consolidation that the SPY has been trading in over longer time frames has allowed the ETF's relative strength index to drop from overbought territory to a more comfortable 68%. If the SPY breaks bullishly from the inside bar pattern, the RSI will head above 70% again, which could indicate a pull back is in the cards for later in the week.
SPY在更长的时间内一直在横盘整理,这使ETF的相对强弱指数从超买区间跌至更舒适的68%。如果SPY从内侧柱形态上看涨突破,RSI将再次突破70%,这可能表明本周晚些时候将出现回调。
The SPY has resistance above at $443.90 and $447.06 and support below at $436.79 and $429.80.
SPY的阻力位高于443.90美元和447.06美元,下方的支撑位为436.79美元和429.80美元。
 Read Next: Gold Miners Trading At Bargain Price To Gold: Is GDX The Buy Opportunity For The Remainder Of 2023?
继续阅读:黄金矿商以低廉的价格交易黄金:GDX 是 2023 年剩余时间的买入机会吗?
Photo via Shutterstock.
照片来自 Shutterstock。