
Zhengyuan Zhihui GroupLtd's (SZSE:300645) 17% CAGR Outpaced the Company's Earnings Growth Over the Same Three-year Period
Zhengyuan Zhihui GroupLtd's (SZSE:300645) 17% CAGR Outpaced the Company's Earnings Growth Over the Same Three-year Period
By buying an index fund, investors can approximate the average market return. But if you buy good businesses at attractive prices, your portfolio returns could exceed the average market return. For example, the Zhengyuan Zhihui Group Co.,Ltd. (SZSE:300645) share price is up 60% in the last three years, clearly besting the market decline of around 17% (not including dividends).
通过购买指数基金,投资者可以近似平均市场回报率。但是,如果你以诱人的价格收购优秀的企业,你的投资组合回报率可能会超过平均市场回报率。例如, 正元智汇集团有限公司, Ltd. (SZSE: 300645) 股价在过去三年中上涨了60%,显然超过了约17%(不包括股息)的市场跌幅。
Since the stock has added CN¥397m to its market cap in the past week alone, let's see if underlying performance has been driving long-term returns.
由于该股仅在过去一周就增加了3.97亿元人民币,因此让我们看看基础表现是否推动了长期回报。
Check out our latest analysis for Zhengyuan Zhihui GroupLtd
查看我们对正源智汇集团有限公司的最新分析
To quote Buffett, 'Ships will sail around the world but the Flat Earth Society will flourish. There will continue to be wide discrepancies between price and value in the marketplace...' One imperfect but simple way to consider how the market perception of a company has shifted is to compare the change in the earnings per share (EPS) with the share price movement.
引用巴菲特的话说:“船只将在世界各地航行,但Flat Earth Society将蓬勃发展。市场上的价格和价值之间将继续存在巨大差异...”考虑市场对公司的看法发生了怎样的变化的一种不完美但简单的方法是将每股收益(EPS)的变化与股价走势进行比较。
Zhengyuan Zhihui GroupLtd was able to grow its EPS at 27% per year over three years, sending the share price higher. The average annual share price increase of 17% is actually lower than the EPS growth. Therefore, it seems the market has moderated its expectations for growth, somewhat. Having said that, the market is still optimistic, given the P/E ratio of 52.50.
正元智汇集团有限公司能够在三年内以每年27%的速度增长每股收益,这推动了股价的上涨。股价年平均涨幅为17%,实际上低于每股收益的增长。因此,市场似乎有所放缓了对增长的预期。话虽如此,鉴于市盈率为52.50,市场仍然持乐观态度。
The company's earnings per share (over time) is depicted in the image below (click to see the exact numbers).
该公司的每股收益(随着时间的推移)如下图所示(点击查看确切数字)。
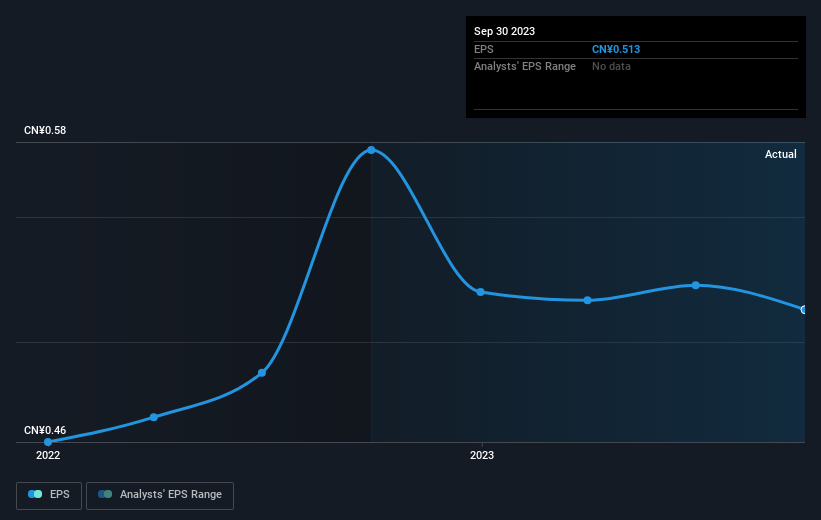
Dive deeper into Zhengyuan Zhihui GroupLtd's key metrics by checking this interactive graph of Zhengyuan Zhihui GroupLtd's earnings, revenue and cash flow.
查看这张正元智汇集团有限公司收益、收入和现金流的交互式图表,深入了解正元智汇集团有限公司的关键指标。
A Different Perspective
不同的视角
While it's certainly disappointing to see that Zhengyuan Zhihui GroupLtd shares lost 4.0% throughout the year, that wasn't as bad as the market loss of 4.6%. Longer term investors wouldn't be so upset, since they would have made 10%, each year, over five years. It could be that the business is just facing some short term problems, but shareholders should keep a close eye on the fundamentals. Is Zhengyuan Zhihui GroupLtd cheap compared to other companies? These 3 valuation measures might help you decide.
尽管看到正元智汇集团股价全年下跌4.0%无疑令人失望,但这还不如市场跌幅4.6%那么严重。长期投资者不会那么沮丧,因为他们本可以在五年内每年赚10%。可能是该业务正面临一些短期问题,但股东应密切关注基本面。与其他公司相比,正元智汇集团有限公司便宜吗?这三种估值指标可能会帮助您做出决定。
If you would prefer to check out another company -- one with potentially superior financials -- then do not miss this free list of companies that have proven they can grow earnings.
如果你想去另一家公司看看 —— 一家财务状况可能优异的公司 —— 那千万不要错过这个 免费的 已证明可以增加收益的公司名单。
Please note, the market returns quoted in this article reflect the market weighted average returns of stocks that currently trade on Chinese exchanges.
请注意,本文引用的市场回报反映了目前在中国交易所交易的股票的市场加权平均回报。
Have feedback on this article? Concerned about the content? Get in touch with us directly. Alternatively, email editorial-team (at) simplywallst.com.
This article by Simply Wall St is general in nature. We provide commentary based on historical data and analyst forecasts only using an unbiased methodology and our articles are not intended to be financial advice. It does not constitute a recommendation to buy or sell any stock, and does not take account of your objectives, or your financial situation. We aim to bring you long-term focused analysis driven by fundamental data. Note that our analysis may not factor in the latest price-sensitive company announcements or qualitative material. Simply Wall St has no position in any stocks mentioned.
对这篇文章有反馈吗?担心内容吗? 取得联系 直接和我们在一起。 或者,给编辑团队 (at) simplywallst.com 发送电子邮件。
Simply Wall St的这篇文章本质上是笼统的。 我们仅使用公正的方法根据历史数据和分析师的预测提供评论,我们的文章无意作为财务建议。 它不构成买入或卖出任何股票的建议,也没有考虑您的目标或财务状况。我们的目标是为您提供由基本面数据驱动的长期重点分析。请注意,我们的分析可能不考虑最新的价格敏感公司公告或定性材料。简而言之,华尔街在上述任何股票中都没有头寸。