Economic Crossroads: Stock Market Reacts To U.S. Jobs Report, Fueling Speculation On Future Rate Cuts
Economic Crossroads: Stock Market Reacts To U.S. Jobs Report, Fueling Speculation On Future Rate Cuts
 Must Read: With The GRAMMYs Just Two Months Out, The Music Industry Is Still Going Strong - What Will It Look Like In 2030?
 The SPDR S&P 500 (NYSE:SPY) popped up about 0.5% higher at one point Friday, despite U.S. Bureau of Labor Statistics data showing non-farm payrolls came in higher-than-expected, which brought into question whether the Federal Reserve will follow through with a rate cut campaign next year.
尽管美国劳工统计局的数据显示非农就业人数高于预期,这使人们质疑美联储明年是否会继续降息运动,但SPDR标准普尔500指数(纽约证券交易所代码:SPY)周五一度上涨约0.5%。
While the news caused the SPY to open slightly lower, bulls came in and bought the dip, causing the market ETF to break above Thursday's high-of-day.
尽管该消息导致SPY开盘小幅走低,但多头却逢低买入,导致市场ETF突破周四的高点。
Whether or not the market will continue higher imminently or continue to trade sideways remains to be seen, but the SPY's uptrend is intact and the ETF is holding above the eight-day exponential moving average (EMA) on the daily chart.
市场是即将继续走高还是继续横盘交易还有待观察,但SPY的上涨趋势完好无损,ETF在日线图上保持在八天指数移动平均线(EMA)上方。
Must Read: With The GRAMMYs Just Two Months Out, The Music Industry Is Still Going Strong - What Will It Look Like In 2030?
必读:格莱美颁奖典礼仅两个月后,音乐行业仍在蓬勃发展——2030年会是什么样子?
Trending: Chances Are You're Wrong On Bidenomics: Survey Finds Wildly Concerning Views About Wealth, Income And Jobs
趋势:你在Bidenomics上可能错了:调查发现关于财富、收入和就业的看法非常令人担忧
More experienced traders who wish to play the SPY either bullishly or bearishly may choose to do so through one of two Direxion ETFs. Bullish traders can enter a short-term position in Direxion Daily S&P 500 Bull 3X Shares (NYSE:SPXL) and bearish traders can trade the inverse ETF, Direxion Daily S&P 500 Bear 3X Shares (NYSE:SPXS).
希望以看涨或看跌的方式玩SPY的经验更丰富的交易者可以选择通过两种Direxion ETF中的一种来玩SPY。看涨的交易者可以在Direxion Daily标准普尔500指数牛市3X股(纽约证券交易所代码:SPXL)中进入短期头寸,看跌的交易者可以交易反向ETF,即Direxion Daily标准普尔500熊3X股(纽约证券交易所代码:SPXS)。
The ETFs: SPXL and SPXS are triple leveraged funds that track the movement of the SPY, seeking a return of 300% or –300% on the return of the benchmark index over a single day.
ETF:SPXL和SPXS是追踪SPY走势的三倍杠杆基金,寻求基准指数在一天内获得300%或-300%的回报。
It should be noted that leveraged ETFs are meant to be used as a trading vehicle as opposed to long-term investments.
应该注意的是,杠杆ETF旨在用作交易工具,而不是长期投资。
Want direct analysis? Find me in the BZ Pro lounge! Click here for a free trial.
想要直接分析?在 BZ Pro 休息室找我!点击此处免费试用。
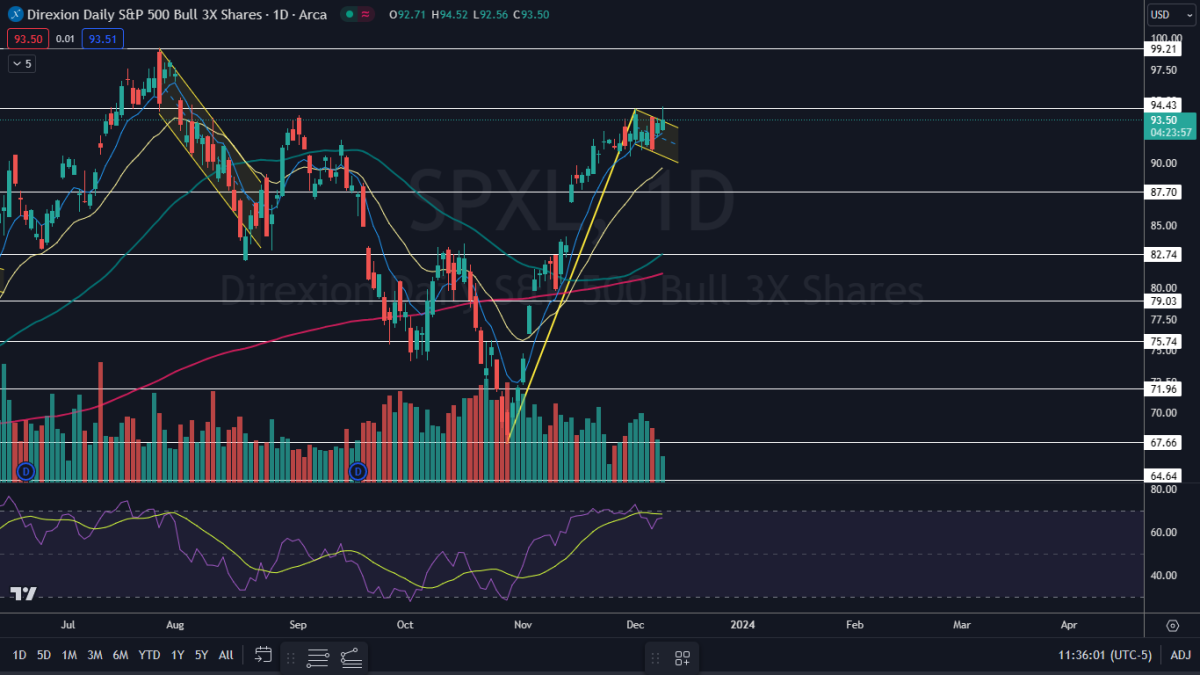
The SPXL Chart: Between Oct. 27 and Friday, SPXL has formed a massive bull flag pattern on the daily chart, with a measured move of a whopping 39.5%. If the pattern is recognized and the SPY breaks up from its own bull flag on higher-than-average volume, SPXL could be headed toward the $126 mark.
SPXL走势图:在10月27日至周五之间,SPXL在日线图上形成了巨大的牛旗形态,测得的涨幅高达39.5%。如果该模式得到识别,并且SPY因交易量高于平均水平而突破自己的牛市,则SPXL可能会走向126美元大关。
- On Friday, SPXL confirmed its uptrend remains intact. The most recent higher low was formed on Wednesday at $90.96 and the most recent confirmed higher high was printed at the $94.31 mark on Dec. 1. If the ETF retraces on Monday and continues to trade within the flag for a longer period, Friday's high-of-day will serve as the next higher high within the uptrend.
- Continued consolidation within the flag would help to drop SPXL's relative strength index (RSI) further down below the 70% level, which the bulls would like to see. When a stock's or ETF's RSI nears or exceeds the 70% mark it becomes overbought, which can be a sell signal for technical traders.
- Bearish traders want to see the ETF drop under the eight-day EMA, which could suggest the uptrend will be negated for a period of time, which could accelerate downside pressure.
- SPXL has resistance above at $94.43 and at $99.21 and support below at $87.70 and at $82.74.
- 周五,SPXL证实其上涨趋势保持不变。最近的较高低点于周三形成,为90.96美元,最近确认的更高高点于12月1日创下94.31美元。如果ETF在周一回撤并在更长的时间内继续在旗帜内交易,则周五的高点将成为上升趋势中的下一个更高的高点。
- 旗帜内的持续盘整将有助于将SPXL的相对强弱指数(RSI)进一步降至多头希望看到的70%以下。当股票或ETF的RSI接近或超过70%大关时,它就会变得超买,这可能是技术交易者的卖出信号。
- 看跌的交易者希望看到ETF跌破八日均线,这可能表明上涨趋势将在一段时间内被抵消,这可能会加剧下行压力。
- SPXL的阻力位高于94.43美元和99.21美元,支撑位低于87.70美元和82.74美元。