
Shanghai Waigaoqiao Free Trade Zone Group (SHSE:900912) Earnings and Shareholder Returns Have Been Trending Downwards for the Last Five Years, but the Stock Grows 8.7% This Past Week
Shanghai Waigaoqiao Free Trade Zone Group (SHSE:900912) Earnings and Shareholder Returns Have Been Trending Downwards for the Last Five Years, but the Stock Grows 8.7% This Past Week
For many, the main point of investing is to generate higher returns than the overall market. But the main game is to find enough winners to more than offset the losers So we wouldn't blame long term Shanghai Waigaoqiao Free Trade Zone Group Co., Ltd. (SHSE:900912) shareholders for doubting their decision to hold, with the stock down 48% over a half decade. And we doubt long term believers are the only worried holders, since the stock price has declined 27% over the last twelve months. The falls have accelerated recently, with the share price down 11% in the last three months. Of course, this share price action may well have been influenced by the 4.7% decline in the broader market, throughout the period.
对于许多人来说,投资的要点是产生比整个市场更高的回报。但是主要的游戏是找到足够的赢家来抵消输家。因此,我们不会指责上海外高桥保税区集团有限公司(SHSE: 900912)的长期股东怀疑他们的持股决定,该股在五年内下跌了48%。我们怀疑长期信徒是唯一担心的持有者,因为股价在过去十二个月中下跌了27%。最近跌势加速,股价在过去三个月中下跌了11%。当然,这种股价走势很可能受到了整个时期大盘下跌4.7%的影响。
On a more encouraging note the company has added US$59m to its market cap in just the last 7 days, so let's see if we can determine what's driven the five-year loss for shareholders.
更令人鼓舞的是,该公司的市值在过去的7天内就增加了5900万美元,因此让我们看看我们能否确定是什么推动了股东五年亏损。
View our latest analysis for Shanghai Waigaoqiao Free Trade Zone Group
查看我们对上海外高桥保税区集团的最新分析
While markets are a powerful pricing mechanism, share prices reflect investor sentiment, not just underlying business performance. One imperfect but simple way to consider how the market perception of a company has shifted is to compare the change in the earnings per share (EPS) with the share price movement.
尽管市场是一种强大的定价机制,但股价反映的是投资者的情绪,而不仅仅是基本的业务表现。考虑市场对公司的看法如何变化的一种不完美但简单的方法是将每股收益(EPS)的变化与股价变动进行比较。
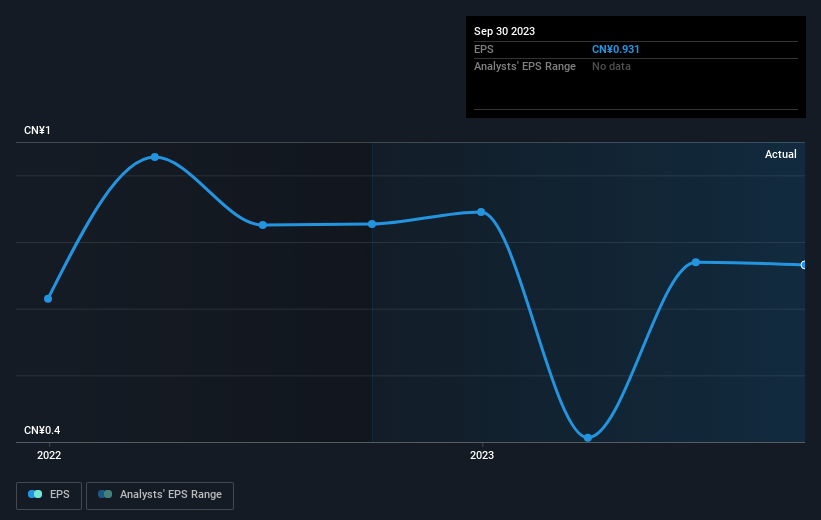
Looking back five years, both Shanghai Waigaoqiao Free Trade Zone Group's share price and EPS declined; the latter at a rate of 0.3% per year. This reduction in EPS is less than the 12% annual reduction in the share price. This implies that the market was previously too optimistic about the stock. The less favorable sentiment is reflected in its current P/E ratio of 5.03.
回顾五年,上海外高桥保税区集团的股价和每股收益均有所下降;后者每年下降0.3%。每股收益的下降幅度低于股价每年12%的降幅。这意味着市场此前对该股过于乐观。不太乐观的情绪反映在其目前的市盈率5.03中。
The company's earnings per share (over time) is depicted in the image below (click to see the exact numbers).
该公司的每股收益(一段时间内)如下图所示(点击查看确切数字)。
We're pleased to report that the CEO is remunerated more modestly than most CEOs at similarly capitalized companies. But while CEO remuneration is always worth checking, the really important question is whether the company can grow earnings going forward. Before buying or selling a stock, we always recommend a close examination of historic growth trends, available here..
我们很高兴地向大家报告,首席执行官的薪水比资本相似公司的大多数首席执行官都要适中。但是,尽管首席执行官的薪酬总是值得检查的,但真正重要的问题是公司未来能否增加收益。在买入或卖出股票之前,我们始终建议仔细研究历史增长趋势,可在此处查阅。
What About Dividends?
那股息呢?
It is important to consider the total shareholder return, as well as the share price return, for any given stock. Whereas the share price return only reflects the change in the share price, the TSR includes the value of dividends (assuming they were reinvested) and the benefit of any discounted capital raising or spin-off. Arguably, the TSR gives a more comprehensive picture of the return generated by a stock. As it happens, Shanghai Waigaoqiao Free Trade Zone Group's TSR for the last 5 years was -32%, which exceeds the share price return mentioned earlier. The dividends paid by the company have thusly boosted the total shareholder return.
重要的是要考虑任何给定股票的股东总回报率和股价回报率。尽管股价回报率仅反映股价的变化,但股东总回报率包括股息的价值(假设已进行再投资)以及任何折扣融资或分拆的收益。可以说,股东总回报率更全面地描述了股票产生的回报。碰巧的是,上海外高桥保税区集团过去5年的股东总回报率为-32%,超过了前面提到的股价回报率。因此,该公司支付的股息提高了 总 股东回报。
A Different Perspective
不同的视角
We regret to report that Shanghai Waigaoqiao Free Trade Zone Group shareholders are down 23% for the year (even including dividends). Unfortunately, that's worse than the broader market decline of 7.7%. However, it could simply be that the share price has been impacted by broader market jitters. It might be worth keeping an eye on the fundamentals, in case there's a good opportunity. Unfortunately, last year's performance may indicate unresolved challenges, given that it was worse than the annualised loss of 6% over the last half decade. Generally speaking long term share price weakness can be a bad sign, though contrarian investors might want to research the stock in hope of a turnaround. I find it very interesting to look at share price over the long term as a proxy for business performance. But to truly gain insight, we need to consider other information, too. For example, we've discovered 2 warning signs for Shanghai Waigaoqiao Free Trade Zone Group (1 shouldn't be ignored!) that you should be aware of before investing here.
我们遗憾地报告,上海外高桥保税区集团的股东今年下降了23%(甚至包括股息)。不幸的是,这比整个市场7.7%的跌幅还要严重。但是,可能只是股价受到了更广泛的市场紧张情绪的影响。如果有很好的机会,可能值得关注基本面。不幸的是,去年的表现可能预示着尚未解决的挑战,因为它比过去五年中6%的年化亏损还要糟糕。总的来说,长期股价疲软可能是一个坏兆头,尽管逆势投资者可能希望研究该股以期出现转机。我发现将长期股价视为业务绩效的代表非常有趣。但是,要真正获得见解,我们还需要考虑其他信息。例如,我们发现了上海外高桥保税区集团的 2 个警告标志(1 个不容忽视!)在这里投资之前,您应该注意这一点。
For those who like to find winning investments this free list of growing companies with recent insider purchasing, could be just the ticket.
对于那些喜欢寻找中奖投资的人来说,这份最近有内幕收购的成长型公司的免费名单可能只是门票。
Please note, the market returns quoted in this article reflect the market weighted average returns of stocks that currently trade on Chinese exchanges.
请注意,本文引用的市场回报反映了目前在中国交易所交易的股票的市场加权平均回报率。
Have feedback on this article? Concerned about the content? Get in touch with us directly. Alternatively, email editorial-team (at) simplywallst.com.
This article by Simply Wall St is general in nature. We provide commentary based on historical data and analyst forecasts only using an unbiased methodology and our articles are not intended to be financial advice. It does not constitute a recommendation to buy or sell any stock, and does not take account of your objectives, or your financial situation. We aim to bring you long-term focused analysis driven by fundamental data. Note that our analysis may not factor in the latest price-sensitive company announcements or qualitative material. Simply Wall St has no position in any stocks mentioned.
对这篇文章有反馈吗?对内容感到担忧?直接联系我们。 或者,给编辑团队 (at) simplywallst.com 发送电子邮件。
Simply Wall St 的这篇文章本质上是笼统的。我们仅使用公正的方法提供基于历史数据和分析师预测的评论,我们的文章并非旨在提供财务建议。它不构成买入或卖出任何股票的建议,也没有考虑到您的目标或财务状况。我们的目标是为您提供由基本数据驱动的长期重点分析。请注意,我们的分析可能不会考虑最新的价格敏感型公司公告或定性材料。华尔街只是没有持有上述任何股票的头寸。