
Capital Allocation Trends At Guangdong Mingzhu GroupLtd (SHSE:600382) Aren't Ideal
Capital Allocation Trends At Guangdong Mingzhu GroupLtd (SHSE:600382) Aren't Ideal
 0.075 = CN¥275m ÷ (CN¥4.1b - CN¥474m) (Based on the trailing twelve months to September 2023).
Ignoring the stock price of a company, what are the underlying trends that tell us a business is past the growth phase? When we see a declining return on capital employed (ROCE) in conjunction with a declining base of capital employed, that's often how a mature business shows signs of aging. Basically the company is earning less on its investments and it is also reducing its total assets. In light of that, from a first glance at Guangdong Mingzhu GroupLtd (SHSE:600382), we've spotted some signs that it could be struggling, so let's investigate.
忽略一家公司的股价,告诉我们企业已经过了增长阶段的潜在趋势是什么?当我们看到下降时 返回 在资本使用率(ROCE)的下降的同时 基础 就所使用的资本而言,成熟的企业通常会以这种方式显示出老化的迹象。基本上,该公司的投资收入减少了,而且总资产也在减少。有鉴于此,乍一看广东明珠集团有限公司(SHSE: 600382),我们发现了一些可能陷入困境的迹象,所以让我们来调查一下。
Return On Capital Employed (ROCE): What Is It?
资本使用回报率(ROCE):这是什么?
If you haven't worked with ROCE before, it measures the 'return' (pre-tax profit) a company generates from capital employed in its business. The formula for this calculation on Guangdong Mingzhu GroupLtd is:
如果你以前没有与ROCE合作过,它会衡量公司从其业务中使用的资本中产生的 “回报”(税前利润)。广东明珠集团有限公司的计算公式为:
Return on Capital Employed = Earnings Before Interest and Tax (EBIT) ÷ (Total Assets - Current Liabilities)
已动用资本回报率 = 息税前收益 (EBIT) ¥(总资产-流动负债)
0.075 = CN¥275m ÷ (CN¥4.1b - CN¥474m) (Based on the trailing twelve months to September 2023).
0.075 = 2.75亿元人民币 ÷(41亿元人民币-4.74亿元人民币) (基于截至2023年9月的过去十二个月)。
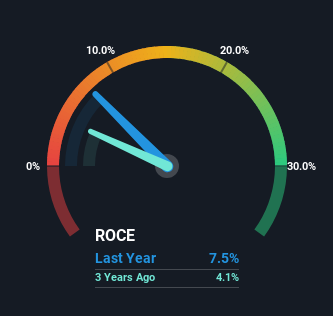
So, Guangdong Mingzhu GroupLtd has an ROCE of 7.5%. On its own, that's a low figure but it's around the 7.3% average generated by the Trade Distributors industry.
因此,广东明珠集团有限公司的投资回报率为7.5%。就其本身而言,这是一个很低的数字,但约为贸易分销商行业的平均7.3%。
See our latest analysis for Guangdong Mingzhu GroupLtd
查看我们对广东明珠集团有限公司的最新分析
While the past is not representative of the future, it can be helpful to know how a company has performed historically, which is why we have this chart above. If you want to delve into the historical earnings, revenue and cash flow of Guangdong Mingzhu GroupLtd, check out these free graphs here.
虽然过去并不能代表未来,但了解一家公司的历史表现可能会有所帮助,这就是我们上面有这张图表的原因。如果您想深入了解广东明珠集团有限公司的历史收益、收入和现金流,请在此处查看这些免费图表。
The Trend Of ROCE
ROCE 的趋势
In terms of Guangdong Mingzhu GroupLtd's historical ROCE trend, it isn't fantastic. Unfortunately, returns have declined substantially over the last five years to the 7.5% we see today. What's equally concerning is that the amount of capital deployed in the business has shrunk by 42% over that same period. The fact that both are shrinking is an indication that the business is going through some tough times. If these underlying trends continue, we wouldn't be too optimistic going forward.
就广东明珠集团有限公司的历史投资回报率走势而言,这并不奇妙。不幸的是,在过去五年中,回报率大幅下降至我们今天看到的7.5%。同样令人担忧的是,该业务中部署的资本金额同期减少了42%。两者都在萎缩,这一事实表明该业务正在经历一段艰难时期。如果这些潜在趋势继续下去,我们对未来不会太乐观。
What We Can Learn From Guangdong Mingzhu GroupLtd's ROCE
我们可以从广东明珠集团有限公司的ROCE中学到什么
In summary, it's unfortunate that Guangdong Mingzhu GroupLtd is shrinking its capital base and also generating lower returns. In spite of that, the stock has delivered a 22% return to shareholders who held over the last five years. Regardless, we don't like the trends as they are and if they persist, we think you might find better investments elsewhere.
总而言之,不幸的是,广东明珠集团有限公司正在缩减其资本基础,同时产生的回报也较低。尽管如此,该股为在过去五年中持股的股东带来了22%的回报。无论如何,我们不喜欢当前的趋势,如果趋势持续下去,我们认为您可能会在其他地方找到更好的投资。
If you'd like to know more about Guangdong Mingzhu GroupLtd, we've spotted 2 warning signs, and 1 of them is significant.
如果您想进一步了解广东明珠集团有限公司,我们已经发现了两个警告标志,其中一个是重要的。
For those who like to invest in solid companies, check out this free list of companies with solid balance sheets and high returns on equity.
对于那些喜欢投资稳健公司的人,可以查看这份资产负债表稳健和股本回报率高的公司的免费清单。
Have feedback on this article? Concerned about the content? Get in touch with us directly. Alternatively, email editorial-team (at) simplywallst.com.
This article by Simply Wall St is general in nature. We provide commentary based on historical data and analyst forecasts only using an unbiased methodology and our articles are not intended to be financial advice. It does not constitute a recommendation to buy or sell any stock, and does not take account of your objectives, or your financial situation. We aim to bring you long-term focused analysis driven by fundamental data. Note that our analysis may not factor in the latest price-sensitive company announcements or qualitative material. Simply Wall St has no position in any stocks mentioned.
对这篇文章有反馈吗?对内容感到担忧?直接联系我们。 或者,给编辑团队 (at) simplywallst.com 发送电子邮件。
Simply Wall St的这篇文章本质上是笼统的。我们仅使用公正的方法根据历史数据和分析师的预测提供评论,我们的文章无意作为财务建议。它不构成买入或卖出任何股票的建议,也没有考虑到您的目标或财务状况。我们的目标是为您提供由基本数据驱动的长期重点分析。请注意,我们的分析可能不考虑最新的价格敏感型公司公告或定性材料。简而言之,华尔街没有持有任何上述股票的头寸。
