
Xinxiang Chemical Fiber (SZSE:000949) Is Reinvesting At Lower Rates Of Return
Xinxiang Chemical Fiber (SZSE:000949) Is Reinvesting At Lower Rates Of Return
 0.019 = CN¥155m ÷ (CN¥12b - CN¥3.9b) (Based on the trailing twelve months to March 2024).
There are a few key trends to look for if we want to identify the next multi-bagger. Firstly, we'd want to identify a growing return on capital employed (ROCE) and then alongside that, an ever-increasing base of capital employed. Ultimately, this demonstrates that it's a business that is reinvesting profits at increasing rates of return. However, after briefly looking over the numbers, we don't think Xinxiang Chemical Fiber (SZSE:000949) has the makings of a multi-bagger going forward, but let's have a look at why that may be.
如果想标识下一个几倍股,就应该注重以下几个关键趋势。首先,我们需要找出资本使用增长。如果您看到这一点,通常意味着这是一家具有出色业务模式和大量盈利再投资机会的公司。说到这一点,我们注意到通用股份(SHSE:601500)的资本回报率有很大变化,让我们来看一下。资产回报率:它是什么?资本雇用回报率 (ROCE) 是一种早期趋势,可以用来识别有可能在长期内翻倍增值的股票,然后在此基础上,要寻找一个不断增长的业务板块和行业板块。这告诉我们这是一台复利机器,能够不断地将其收益再投入业务,从而产生更高的回报。因此,在这点上,Materialise (纳斯达克:MTLS) 看起来相当有前途,因为它在资本回报方面的趋势相当不错。资产回报率 = 利息和所得税前收益(EBIT)÷(总资产-流动负债)最终结果表明,这是一个业务在增加的利润回报率上重新投资的公司。然而,在简短地浏览数字之后,我们认为进入未来的时候,新乡化纤(SZSE:000949)没有成为一只多倍股的迹象,但是让我们看看为什么。
What Is Return On Capital Employed (ROCE)?
我们对 Enphase Energy 的资本雇用回报率的看法:正如我们上面看到的,Enphase Energy 的资本回报率没有提高,但它正在重新投资于业务。投资者必须认为未来会有更好的前景,因为股票表现良好,使持股五年以上的股东获得了 690% 的收益。最终,如果基本趋势持续存在,我们不会对它成为一只多头股持有期很久很有信心。
If you haven't worked with ROCE before, it measures the 'return' (pre-tax profit) a company generates from capital employed in its business. To calculate this metric for Xinxiang Chemical Fiber, this is the formula:
如果您之前没有使用过ROCE,它可以衡量公司从其业务中使用的资本产生的'回报'(税前利润)。 要为新乡化纤计算这个指标,可以使用以下公式:
Return on Capital Employed = Earnings Before Interest and Tax (EBIT) ÷ (Total Assets - Current Liabilities)
资产雇用回报率(ROCE)是指企业利润,即企业税前利润除以企业投入的总资本(负债加股权)。如果ROCE高于企业财务成本的承受能力,那么企业就会创造出更多的价值。
0.019 = CN¥155m ÷ (CN¥12b - CN¥3.9b) (Based on the trailing twelve months to March 2024).
0.019 = CN¥ 15500万 ÷ (CN¥ 120亿 - CN¥ 3.9b)在Elevance Health上,我们已经注意到的趋势是相当令人放心的。数据显示,过去五年资产回报率大幅提高至15%。投资所用资产的规模也增加了30%。这表明有很多机会进行内部资本投资,并以更高的速度不断增长,这种组合在多倍增长方面很常见。.
So, Xinxiang Chemical Fiber has an ROCE of 1.9%. In absolute terms, that's a low return and it also under-performs the Chemicals industry average of 5.5%.
所以,新乡化纤的ROCE为1.9%。 从绝对意义上讲,这是一个很低的回报,并且也表现不佳,低于化学品行业平均水平5.5%。
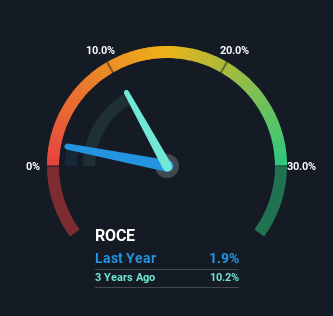
Historical performance is a great place to start when researching a stock so above you can see the gauge for Xinxiang Chemical Fiber's ROCE against it's prior returns. If you want to delve into the historical earnings , check out these free graphs detailing revenue and cash flow performance of Xinxiang Chemical Fiber.
历史业绩是研究股票的好出发点,因此您可以在上面看到新乡化纤ROCE与其先前的回报的比较情况。 如果您想深入研究历史收益,请查看这些免费的图表,详情涵盖新乡化纤的营收和现金流业绩。
What Can We Tell From Xinxiang Chemical Fiber's ROCE Trend?
从新乡化纤的ROCE趋势中,我们可以发现什么?
In terms of Xinxiang Chemical Fiber's historical ROCE movements, the trend isn't fantastic. Around five years ago the returns on capital were 4.3%, but since then they've fallen to 1.9%. On the other hand, the company has been employing more capital without a corresponding improvement in sales in the last year, which could suggest these investments are longer term plays. It's worth keeping an eye on the company's earnings from here on to see if these investments do end up contributing to the bottom line.
就新乡化纤的历史ROCE趋势而言,这种趋势并不好。 大约五年前,资本回报率达到了4.3%,但自那时以来已降至1.9%。 另一方面,公司在过去一年中增加了更多资本,但没有相应的销售业绩改善,这可能表明这些投资是长期的。 值得关注的是,从这里开始关注公司的收益情况,以查看这些投资是否最终为底线做出了贡献。
What We Can Learn From Xinxiang Chemical Fiber's ROCE
结论是,我们发现新乡化纤正在对业务进行再投资,但回报正在下降。由于过去五年中,股票仅为股东总共带来了30%的回报,因此投资者可能会认识到这些趋势。因此,如果您正在寻找多倍股,则基本趋势表明您可能在其他地方拥有更好的机会。
To conclude, we've found that Xinxiang Chemical Fiber is reinvesting in the business, but returns have been falling. And investors may be recognizing these trends since the stock has only returned a total of 30% to shareholders over the last five years. So if you're looking for a multi-bagger, the underlying trends indicate you may have better chances elsewhere.
新乡化纤确实存在一些风险,我们在投资分析中发现了4个警告信号,其中3个有点不愉快...
Xinxiang Chemical Fiber does come with some risks though, we found 4 warning signs in our investment analysis, and 3 of those are a bit unpleasant...
开始研究股票时,历史业绩是一个很好的出发点。因此,在此您可以查看新乡化纤ROCE的计量单位为2019-2023的历史走向,并且下方还可以免费查询历史营收和现金流量表现一番。如果您对股票价格感兴趣,可以在新乡化纤的近期股票图表中跟踪最新的价格,还可以查看最新交易成交。
For those who like to invest in solid companies, check out this free list of companies with solid balance sheets and high returns on equity.
Hao Tian International Construction Investment Group确实存在一些风险,我们已经发现了一条警示标志,你可能会感兴趣。对于那些喜欢投资于实力雄厚的公司的人,可以查看这个由财务状况强大、股本回报率高的公司组成的免费列表。
Have feedback on this article? Concerned about the content? Get in touch with us directly. Alternatively, email editorial-team (at) simplywallst.com.
This article by Simply Wall St is general in nature. We provide commentary based on historical data and analyst forecasts only using an unbiased methodology and our articles are not intended to be financial advice. It does not constitute a recommendation to buy or sell any stock, and does not take account of your objectives, or your financial situation. We aim to bring you long-term focused analysis driven by fundamental data. Note that our analysis may not factor in the latest price-sensitive company announcements or qualitative material. Simply Wall St has no position in any stocks mentioned.
对本文有反馈?关于内容有所顾虑?直接和我们联系。或者,发送电子邮件至editorial-team (at) simplywallst.com。
这篇文章是Simply Wall St的一般性文章。我们根据历史数据和分析师预测提供评论,只使用公正的方法论,我们的文章并不意味着提供任何金融建议。文章不构成买卖任何股票的建议,也不考虑您的目标或您的财务状况。我们的目标是带给您基本数据驱动的长期关注分析。请注意,我们的分析可能不考虑最新的价格敏感公司公告或定性材料。Simply Wall St没有任何股票头寸。
