
Is Universal Display Corporation's (NASDAQ:OLED) Latest Stock Performance A Reflection Of Its Financial Health?
Is Universal Display Corporation's (NASDAQ:OLED) Latest Stock Performance A Reflection Of Its Financial Health?
Universal Display's (NASDAQ:OLED) stock is up by a considerable 34% over the past three months. Given the company's impressive performance, we decided to study its financial indicators more closely as a company's financial health over the long-term usually dictates market outcomes. Specifically, we decided to study Universal Display's ROE in this article.
过去三个月,Universal Display(纳斯达克:oled概念)的股票上涨了惊人的34%。鉴于该公司的出色表现,我们决定更仔细地研究其财务指标,因为长期来看,一家公司的财务健康状况通常决定市场结果。具体来说,我们决定在本文中研究Universal Display的roe。
Return on equity or ROE is a key measure used to assess how efficiently a company's management is utilizing the company's capital. In other words, it is a profitability ratio which measures the rate of return on the capital provided by the company's shareholders.
净资产收益率(roe)是衡量公司经营管理层如何有效利用公司资本的关键指标。换言之,它是一种利润率,衡量由公司股东提供的资本的回报率。
How Do You Calculate Return On Equity?
怎样计算ROE?
ROE can be calculated by using the formula:
净资产收益率可以使用以下公式进行计算:
Return on Equity = Net Profit (from continuing operations) ÷ Shareholders' Equity
净资产收益率 = 净利润(从持续经营中获得)÷ 股东权益
So, based on the above formula, the ROE for Universal Display is:
因此,根据上述公式,全球盛显公司的 ROE 为:
15% = US$220m ÷ US$1.5b (Based on the trailing twelve months to March 2024).
15% = US$220m ÷ US$1.5b (基于2024年3月过去的12个月)。
The 'return' is the profit over the last twelve months. Another way to think of that is that for every $1 worth of equity, the company was able to earn $0.15 in profit.
“回报”是过去十二个月的利润,也可以这样认为,对于每一美元的股权,公司能够获得0.15美元的利润。
What Is The Relationship Between ROE And Earnings Growth?
既然我们已经确定ROE是一种有效的利润生成标准,用于评估公司未来的盈利能力,我们现在需要评估公司“保留”为未来增长而重新投资的利润多少,这使我们对公司的增长潜力有了一个了解。一般而言,在其他条件相等的情况下,ROE和利润留存高的公司,增长率比没有这些属性的公司要高。
Thus far, we have learned that ROE measures how efficiently a company is generating its profits. Depending on how much of these profits the company reinvests or "retains", and how effectively it does so, we are then able to assess a company's earnings growth potential. Assuming everything else remains unchanged, the higher the ROE and profit retention, the higher the growth rate of a company compared to companies that don't necessarily bear these characteristics.
因此,我们已经了解到ROE衡量公司如何高效地创造利润。根据公司重新投资或“保留”的利润数量以及其有效性,我们随后能够评估公司的收益增长潜力。假设其他所有因素均保持不变,则ROE和利润保留率越高,相对于不一定具备这些特征的公司,公司的增长率就越高。
Universal Display's Earnings Growth And 15% ROE
Universal Display的收益增长和15%的roe
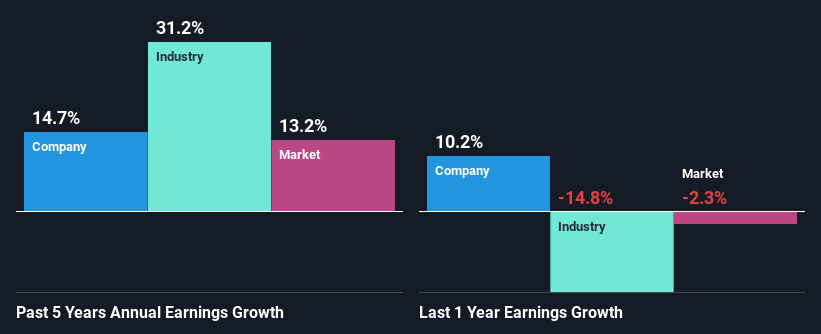
At first glance, Universal Display seems to have a decent ROE. Further, the company's ROE is similar to the industry average of 15%. This certainly adds some context to Universal Display's moderate 15% net income growth seen over the past five years.
乍一看,Universal Display的roe似乎不错。此外,该公司的roe与行业平均水平相似,均为15%。这无疑为Universal Display过去五年中适度的15%净收入增长增添了一些上下文。
We then compared Universal Display's net income growth with the industry and found that the company's growth figure is lower than the average industry growth rate of 31% in the same 5-year period, which is a bit concerning.
然后我们将Universal Display的净收入增长与行业进行比较,并发现该公司的增长数字低于在同一5年期间的行业平均增长率31%,这有点令人担忧。
Earnings growth is an important metric to consider when valuing a stock. What investors need to determine next is if the expected earnings growth, or the lack of it, is already built into the share price. By doing so, they will have an idea if the stock is headed into clear blue waters or if swampy waters await. Is Universal Display fairly valued compared to other companies? These 3 valuation measures might help you decide.
收益增长是考虑估值股票时需要考虑的重要指标。投资者需要判断的是,预期的收益增长率,或者缺乏收益增长率,是否已经反映在股票价格中。通过这样做,他们将对股票是否进入清晰的蓝色水域,还是要面对沼泽水域有了一个想法。与其他公司相比,Universal Display的估值是否合理?这三项估值指标可能会帮助您决定。
Is Universal Display Efficiently Re-investing Its Profits?
Universal Display是否高效地再投资收益?
Universal Display has a healthy combination of a moderate three-year median payout ratio of 27% (or a retention ratio of 73%) and a respectable amount of growth in earnings as we saw above, meaning that the company has been making efficient use of its profits.
正如我们上面所看到的,Universal Display具有中等的三年中位数支付比率为27%(或保留比率为73%)和可观的盈利增长,这意味着该公司一直在有效地利用其利润。此外,Universal Display在七年的时间内支付了分红,这意味着公司非常重视与股东分享其利润。根据最新的分析师预测,我们发现该公司未来三年的支付比率预计将保持稳定在27%。
Additionally, Universal Display has paid dividends over a period of seven years which means that the company is pretty serious about sharing its profits with shareholders. Based on the latest analysts' estimates, we found that the company's future payout ratio over the next three years is expected to hold steady at 27%.
总体而言,我们对Universal Display的表现感到相当满意。特别是,我们喜欢该公司正在大量再投资其业务,并以高回报率进行。因此,其盈利增长的相当程度并不令人惊讶。我们还研究了最新的分析师预测,并发现该公司的盈利增长预计将类似于其当前的增长率。要了解更多关于公司的最新分析师预测,请查看此分析师预测可视化。
Summary
总的来说,我们对伟明环保的表现非常满意。具体而言,我们喜欢公司以高回报率再投资了其利润的很大一部分。当然,这导致公司的收益大幅增长。但是,最新的行业分析师预测表明,该公司的收益预计将加速增长。
Overall, we are quite pleased with Universal Display's performance. Particularly, we like that the company is reinvesting heavily into its business, and at a high rate of return. As a result, the decent growth in its earnings is not surprising. We also studied the latest analyst forecasts and found that the company's earnings growth is expected be similar to its current growth rate. To know more about the latest analysts predictions for the company, check out this visualization of analyst forecasts for the company.
总的来说,我们对universal display的表现感到相当满意。特别是,我们喜欢这家公司以高回报率大量重新投资业务。因此,其盈利的不错增长并不令人意外。我们还研究了最新的分析师预测,并发现该公司的盈利增长预计将与其当前的增长速度相似。想进一步了解公司最新的分析师预测,请查看这个可视化分析师预测的页面。
Have feedback on this article? Concerned about the content? Get in touch with us directly. Alternatively, email editorial-team (at) simplywallst.com.
This article by Simply Wall St is general in nature. We provide commentary based on historical data and analyst forecasts only using an unbiased methodology and our articles are not intended to be financial advice. It does not constitute a recommendation to buy or sell any stock, and does not take account of your objectives, or your financial situation. We aim to bring you long-term focused analysis driven by fundamental data. Note that our analysis may not factor in the latest price-sensitive company announcements or qualitative material. Simply Wall St has no position in any stocks mentioned.
对本文有反馈?关于内容有所顾虑?直接和我们联系。或者,发送电子邮件至editorial-team (at) simplywallst.com。
这篇文章是Simply Wall St的一般性文章。我们根据历史数据和分析师预测提供评论,只使用公正的方法论,我们的文章并不意味着提供任何金融建议。文章不构成买卖任何股票的建议,也不考虑您的目标或您的财务状况。我们的目标是带给您基本数据驱动的长期关注分析。请注意,我们的分析可能不考虑最新的价格敏感公司公告或定性材料。Simply Wall St没有任何股票头寸。
Have feedback on this article? Concerned about the content? Get in touch with us directly. Alternatively, email editorial-team@simplywallst.com
对本文有反馈?关于内容有所顾虑?直接和我们联系。或者发送电子邮件至editorial-team@simplywallst.com。