
Johnson & Johnson's Golden Cross: A Bullish Prescription For Investors?
Johnson & Johnson's Golden Cross: A Bullish Prescription For Investors?
Johnson & Johnson (NYSE:JNJ) has just made a significant technical move, achieving a Golden Cross.
强生公司(纽交所:JNJ)刚刚进行了重大的技术动作,实现了一个金叉。
This technical pattern occurs when a stock's short-term moving average crosses above its long-term moving average, indicating a potential shift from a bearish to a bullish trend.
这种技术模式发生在股票的短期移动平均线上穿过长期移动平均线时,表明可能从看淡趋势转变为看好趋势。
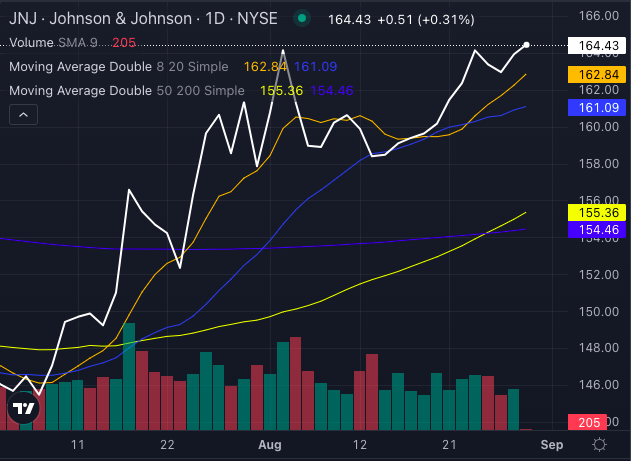
Chart created using Benzinga Pro
使用Benzinga Pro创建的图表
For Johnson & Johnson, the stock's 50-day simple moving average (SMA) of $155.36 has crossed above the 200-day SMA of $154.46, signaling strong upward momentum.
对于强生公司而言,股票的50天简单移动平均线(SMA)为155.36美元,已经超过了200天SMA的154.46美元,表明强劲的上行势头。
Golden Cross: What It Means For Johnson & Johnson Investors
金叉:对强生公司投资者意味着什么
A Golden Cross is considered a bullish indicator, suggesting that Johnson & Johnson stock could be entering a period of sustained upward momentum.
金叉被认为是一个看好的信号,暗示强生公司股票可能正在进入持续上行势头的时期。
The stock currently trades at $164.43, comfortably above its eight-day SMA of $162.84, 20-day SMA of $161.09 and 50-day SMA of $155.36. These signals collectively point towards strong buying pressure and a bullish trend.
该股目前交易于164.43美元,远高于其8日SMA的162.84美元、20日SMA的161.09美元和50日SMA的155.36美元。这些信号共同指向强劲的买压和看好趋势。
Short-Term Strength: Moving Averages Confirm the Trend
近期强势:移动平均线确认趋势
- 8-Day SMA: With Johnson & Johnson stock trading at $164.43 against the eight-day SMA of $162.84, the short-term outlook remains bullish.
- 20-Day SMA: The 20-day SMA stands at $161.09, also below the current price, reinforcing the bullish sentiment.
- 50-Day SMA: Johnson & Johnson stock's 50-day SMA of $155.36 further supports the bullish narrative, as the stock remains well above this level.
- 200-Day SMA: The long-term trend remains bullish as the current price far exceeds the 200-day SMA of $154.46.
- 8日简单移动平均线(SMA):与强生公司股票交易价164.43美元相比,8日SMA为162.84美元,短期展望依然看好。
- 20日简单移动平均线(SMA):20日SMA为161.09美元,同样低于当前价格,增强看多情绪。
- 50日简单移动平均线(SMA):强生公司股票的50日SMA为155.36美元,进一步支持看多论调,因为股票价格远高于该水平。
- 200日简单移动平均线(SMA):由于当前价格远超过154.46美元的200日SMA,长期趋势仍然看好。
Read Also: Johnson & Johnson Seeks FDA Approval For Muscle Weakness Drug And Gears Up Showdown With Argenx and UCB
阅读更多:强生公司寻求FDA批准肌无力药物,并准备与Argenx和UCB展开较量
Fundamental Backing: Positive Catalysts Ahead
基本面支持:未来有积极因素
Johnson & Johnson's recent submission of a Biologics License Application (BLA) to the FDA for nipocalimab, aimed at treating generalized myasthenia gravis (gMG), adds a strong fundamental tailwind to the stock.
强生公司最近向FDA提交了一份生物制品许可申请(BLA),用于治疗全身性重症肌无力(gMG),为股票增添了强大的基本面推动力。
The company's ongoing efforts to expand its oncology pipeline, combined with strategic acquisitions like V-Wave Ltd., are set to bolster its growth prospects.
该公司不断努力拓展其肿瘤学产品线,再加上V-Wave Ltd.等战略性收购,将提升其增长前景。
Bullish Signals For Johnson & Johnson
关于强生的看好信号
With the Golden Cross in play and a series of fundamental catalysts on the horizon, Johnson & Johnson's stock appears poised for continued strength.
黄金交叉正在发挥作用,未来还有一系列基本面的催化剂,强生的股票似乎有望继续保持强势。
The bullish technical indicators and the company's strategic initiatives position Johnson & Johnson as a compelling opportunity for investors looking to capitalize on its upward momentum.
看多的技术指标和公司的战略举措使强生成为投资者寻求利用其上升势头的一个引人注目的机会。
- Johnson & Johnson Aims New Policy For Hospital Payments Under 340B Drug Discount Program Related To Its Flagship Blood Thinner And Arthritis Drugs
- 强生公司旨在医院支付3400亿药物折扣计划下的新策略,与其旗舰血液稀释剂和关节炎药物有关
Image: Shutterstock
图片:shutterstock