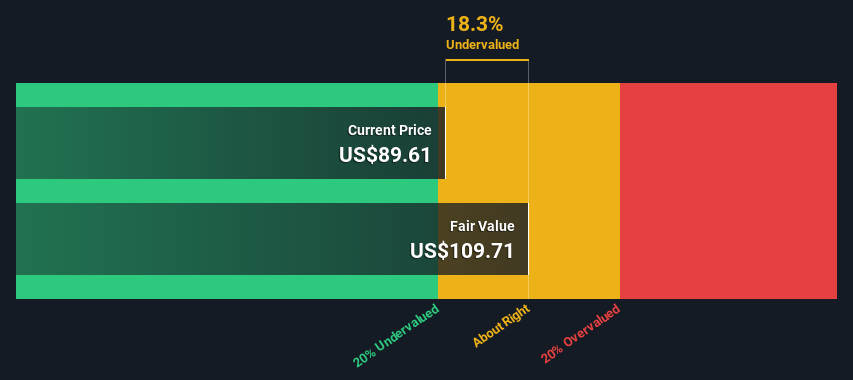
American Woodmark's estimated fair value is US$110 based on 2 Stage Free Cash Flow to Equity
Current share price of US$89.61 suggests American Woodmark is potentially trading close to its fair value
The US$105 analyst price target for AMWD is 4.8% less than our estimate of fair value
Today we'll do a simple run through of a valuation method used to estimate the attractiveness of American Woodmark Corporation (NASDAQ:AMWD) as an investment opportunity by projecting its future cash flows and then discounting them to today's value. The Discounted Cash Flow (DCF) model is the tool we will apply to do this. Don't get put off by the jargon, the math behind it is actually quite straightforward.
We would caution that there are many ways of valuing a company and, like the DCF, each technique has advantages and disadvantages in certain scenarios. If you still have some burning questions about this type of valuation, take a look at the Simply Wall St analysis model.
The Model
We are going to use a two-stage DCF model, which, as the name states, takes into account two stages of growth. The first stage is generally a higher growth period which levels off heading towards the terminal value, captured in the second 'steady growth' period. To begin with, we have to get estimates of the next ten years of cash flows. Where possible we use analyst estimates, but when these aren't available we extrapolate the previous free cash flow (FCF) from the last estimate or reported value. We assume companies with shrinking free cash flow will slow their rate of shrinkage, and that companies with growing free cash flow will see their growth rate slow, over this period. We do this to reflect that growth tends to slow more in the early years than it does in later years.
Generally we assume that a dollar today is more valuable than a dollar in the future, so we discount the value of these future cash flows to their estimated value in today's dollars:
10-year free cash flow (FCF) forecast
2025
2026
2027
2028
2029
2030
2031
2032
2033
2034
Levered FCF ($, Millions)
US$93.3m
US$133.2m
US$119.5m
US$111.8m
US$107.6m
US$105.6m
US$105.0m
US$105.4m
US$106.4m
US$108.0m
Growth Rate Estimate Source
Analyst x1
Analyst x1
Est @ -10.27%
Est @ -6.44%
Est @ -3.76%
Est @ -1.88%
Est @ -0.57%
Est @ 0.35%
Est @ 1.00%
Est @ 1.45%
Present Value ($, Millions) Discounted @ 7.9%
US$86.5
US$114
US$95.2
US$82.5
US$73.6
US$66.9
US$61.7
US$57.4
US$53.7
US$50.5
("Est" = FCF growth rate estimated by Simply Wall St) Present Value of 10-year Cash Flow (PVCF) = US$742m
We now need to calculate the Terminal Value, which accounts for all the future cash flows after this ten year period. For a number of reasons a very conservative growth rate is used that cannot exceed that of a country's GDP growth. In this case we have used the 5-year average of the 10-year government bond yield (2.5%) to estimate future growth. In the same way as with the 10-year 'growth' period, we discount future cash flows to today's value, using a cost of equity of 7.9%.
Present Value of Terminal Value (PVTV)= TV / (1 + r)10= US$2.0b÷ ( 1 + 7.9%)10= US$958m
The total value is the sum of cash flows for the next ten years plus the discounted terminal value, which results in the Total Equity Value, which in this case is US$1.7b. To get the intrinsic value per share, we divide this by the total number of shares outstanding. Relative to the current share price of US$89.6, the company appears about fair value at a 18% discount to where the stock price trades currently. The assumptions in any calculation have a big impact on the valuation, so it is better to view this as a rough estimate, not precise down to the last cent.
NasdaqGS:AMWD Discounted Cash Flow September 2nd 2024
Important Assumptions
Now the most important inputs to a discounted cash flow are the discount rate, and of course, the actual cash flows. If you don't agree with these result, have a go at the calculation yourself and play with the assumptions. The DCF also does not consider the possible cyclicality of an industry, or a company's future capital requirements, so it does not give a full picture of a company's potential performance. Given that we are looking at American Woodmark as potential shareholders, the cost of equity is used as the discount rate, rather than the cost of capital (or weighted average cost of capital, WACC) which accounts for debt. In this calculation we've used 7.9%, which is based on a levered beta of 1.311. Beta is a measure of a stock's volatility, compared to the market as a whole. We get our beta from the industry average beta of globally comparable companies, with an imposed limit between 0.8 and 2.0, which is a reasonable range for a stable business.
SWOT Analysis for American Woodmark
Strength
Debt is not viewed as a risk.
Balance sheet summary for AMWD.
Weakness
Earnings declined over the past year.
Opportunity
Current share price is below our estimate of fair value.
Threat
Annual revenue is forecast to grow slower than the American market.
What else are analysts forecasting for AMWD?
Moving On:
Although the valuation of a company is important, it ideally won't be the sole piece of analysis you scrutinize for a company. DCF models are not the be-all and end-all of investment valuation. Instead the best use for a DCF model is to test certain assumptions and theories to see if they would lead to the company being undervalued or overvalued. For example, changes in the company's cost of equity or the risk free rate can significantly impact the valuation. For American Woodmark, we've compiled three important factors you should further research:
Financial Health: Does AMWD have a healthy balance sheet? Take a look at our free balance sheet analysis with six simple checks on key factors like leverage and risk.
Future Earnings: How does AMWD's growth rate compare to its peers and the wider market? Dig deeper into the analyst consensus number for the upcoming years by interacting with our free analyst growth expectation chart.
Other High Quality Alternatives: Do you like a good all-rounder? Explore our interactive list of high quality stocks to get an idea of what else is out there you may be missing!
PS. Simply Wall St updates its DCF calculation for every American stock every day, so if you want to find the intrinsic value of any other stock just search here.
Have feedback on this article? Concerned about the content?Get in touch with us directly. Alternatively, email editorial-team (at) simplywallst.com. This article by Simply Wall St is general in nature. We provide commentary based on historical data and analyst forecasts only using an unbiased methodology and our articles are not intended to be financial advice. It does not constitute a recommendation to buy or sell any stock, and does not take account of your objectives, or your financial situation. We aim to bring you long-term focused analysis driven by fundamental data. Note that our analysis may not factor in the latest price-sensitive company announcements or qualitative material. Simply Wall St has no position in any stocks mentioned.

 Generally we assume that a dollar today is more valuable than a dollar in the future, so we discount the value of these future cash flows to their estimated value in today's dollars:
  通常我们认为今天的一美元比未来的一美元更有价值,因此我们将这些未来的现金流折现为今天的估计价值: