
Investors More Bullish on Sally Beauty Holdings (NYSE:SBH) This Week as Stock Pops 11%, Despite Earnings Trending Downwards Over Past Year
Investors More Bullish on Sally Beauty Holdings (NYSE:SBH) This Week as Stock Pops 11%, Despite Earnings Trending Downwards Over Past Year
 Over the last twelve months, Sally Beauty Holdings actually shrank its EPS by 7.6%.
 Passive investing in index funds can generate returns that roughly match the overall market. But one can do better than that by picking better than average stocks (as part of a diversified portfolio). To wit, the Sally Beauty Holdings, Inc. (NYSE:SBH) share price is 46% higher than it was a year ago, much better than the market return of around 24% (not including dividends) in the same period. If it can keep that out-performance up over the long term, investors will do very well! In contrast, the longer term returns are negative, since the share price is 22% lower than it was three years ago.
通过投资于指数基金,可以获得与整体市场大致相当的回报。但是,通过挑选优于平均水平的股票(作为多样化的投资组合的一部分),可以获得更好的回报。以纽交所股票代码:SBH的莎莉美容控股公司(Sally Beauty Holdings, Inc.)为例,其股价比一年前高出46%,远远优于同期市场回报率约24%(不包括股息)。如果它能在长期内保持这种超额表现,投资者将会表现出色!相比之下,从长期来看,回报率是负的,因为股价比三年前下跌了22%。
Since the stock has added US$128m to its market cap in the past week alone, let's see if underlying performance has been driving long-term returns.
由于该股票在过去一周中市值增加了1.28亿美元,让我们看看背后的业绩是否推动了长期回报。
While the efficient markets hypothesis continues to be taught by some, it has been proven that markets are over-reactive dynamic systems, and investors are not always rational. One imperfect but simple way to consider how the market perception of a company has shifted is to compare the change in the earnings per share (EPS) with the share price movement.
虽然一些人仍然相信有效市场假说,但已经证明市场是过度反应的动态系统,投资者并不总是理性的。一个不完美但简单的方法来考虑公司市场看法的变化是比较每股收益(EPS)的变化和股价的波动。
Over the last twelve months, Sally Beauty Holdings actually shrank its EPS by 7.6%.
在过去12个月中,莎莉美容控股公司(Sally Beauty Holdings)的每股收益实际上下降了7.6%。
This means it's unlikely the market is judging the company based on earnings growth. Therefore, it seems likely that investors are putting more weight on metrics other than EPS, at the moment.
这意味着市场不太可能根据收益增长来评估公司。因此,目前看来,投资者更加重视除每股收益之外的指标。
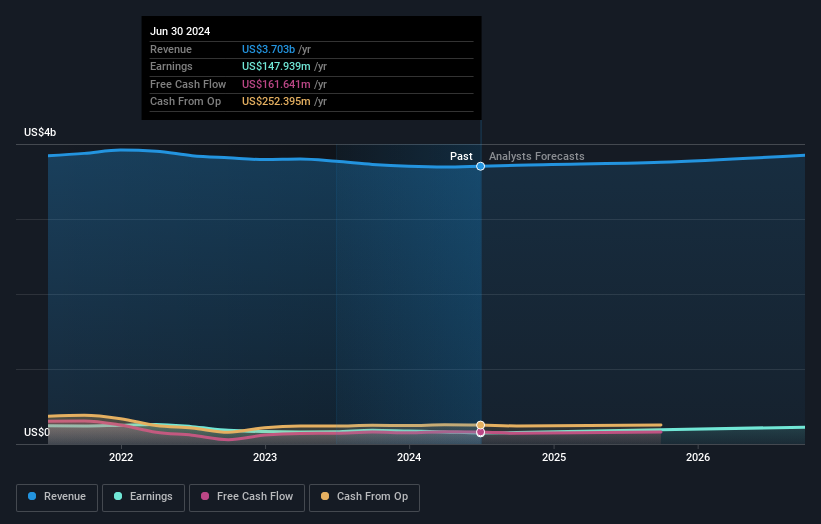
Revenue was pretty flat year on year, but maybe a closer look at the data can explain the market optimism.
营业收入去年同比基本持平,但可能进一步分析数据可以解释市场的乐观情绪。
You can see below how earnings and revenue have changed over time (discover the exact values by clicking on the image).
您可以看到以下收益和营收的变化情况(通过单击图像了解精确值)。
You can see how its balance sheet has strengthened (or weakened) over time in this free interactive graphic.
你可以在这个免费的互动图表中看到它的资产负债表如何随着时间的推移而加强(或削弱)。
A Different Perspective
不同的观点
It's nice to see that Sally Beauty Holdings shareholders have received a total shareholder return of 46% over the last year. That certainly beats the loss of about 2% per year over the last half decade. We generally put more weight on the long term performance over the short term, but the recent improvement could hint at a (positive) inflection point within the business. I find it very interesting to look at share price over the long term as a proxy for business performance. But to truly gain insight, we need to consider other information, too. Even so, be aware that Sally Beauty Holdings is showing 1 warning sign in our investment analysis , you should know about...
很高兴看到莎莉美容控股公司股东在过去一年中获得了总股东回报率为46%。这当然要比过去五年每年2%的亏损要好得多。我们通常更看重长期表现而非短期表现,但近期的改善可能暗示着业务内部的(积极)拐点。我发现长期股价作为业务表现的一种代理非常有趣。但为了真正获得洞察力,我们还需要考虑其他信息。即便如此,请注意莎莉美容控股公司在我们的投资分析中显示出1个警示信号,你应该了解一下...
For those who like to find winning investments this free list of undervalued companies with recent insider purchasing, could be just the ticket.
对于那些喜欢寻找获胜投资的人来说,最近有内部购买的低估公司免费列表可能是一个很好的选择。
Please note, the market returns quoted in this article reflect the market weighted average returns of stocks that currently trade on American exchanges.
请注意,本文所引述的市场回报反映了目前在美国交易所上市的股票的市场加权平均回报。
Have feedback on this article? Concerned about the content? Get in touch with us directly. Alternatively, email editorial-team (at) simplywallst.com.
This article by Simply Wall St is general in nature. We provide commentary based on historical data and analyst forecasts only using an unbiased methodology and our articles are not intended to be financial advice. It does not constitute a recommendation to buy or sell any stock, and does not take account of your objectives, or your financial situation. We aim to bring you long-term focused analysis driven by fundamental data. Note that our analysis may not factor in the latest price-sensitive company announcements or qualitative material. Simply Wall St has no position in any stocks mentioned.
对本文有任何反馈?对内容有任何疑虑?请直接与我们联系。或者,发送电子邮件至editorial-team@simplywallst.com。
这篇文章是Simply Wall St的一般性文章。我们根据历史数据和分析师预测提供评论,只使用公正的方法论,我们的文章并不意味着提供任何金融建议。文章不构成买卖任何股票的建议,也不考虑您的目标或您的财务状况。我们的目标是带给您基本数据驱动的长期关注分析。请注意,我们的分析可能不考虑最新的价格敏感公司公告或定性材料。Simply Wall St没有任何股票头寸。
