You may think that with a price-to-sales (or "P/S") ratio of 0.7x Xperi Inc. (NYSE:XPER) is definitely a stock worth checking out, seeing as almost half of all the Software companies in the United States have P/S ratios greater than 5.3x and even P/S above 13x aren't out of the ordinary. However, the P/S might be quite low for a reason and it requires further investigation to determine if it's justified.
NYSE:XPER Price to Sales Ratio vs Industry November 13th 2024
What Does Xperi's Recent Performance Look Like?
While the industry has experienced revenue growth lately, Xperi's revenue has gone into reverse gear, which is not great. The P/S ratio is probably low because investors think this poor revenue performance isn't going to get any better. So while you could say the stock is cheap, investors will be looking for improvement before they see it as good value.
Want the full picture on analyst estimates for the company? Then our free report on Xperi will help you uncover what's on the horizon.
Do Revenue Forecasts Match The Low P/S Ratio?
Xperi's P/S ratio would be typical for a company that's expected to deliver very poor growth or even falling revenue, and importantly, perform much worse than the industry.
Taking a look back first, the company's revenue growth last year wasn't something to get excited about as it posted a disappointing decline of 2.1%. At least revenue has managed not to go completely backwards from three years ago in aggregate, thanks to the earlier period of growth. So it appears to us that the company has had a mixed result in terms of growing revenue over that time.
Shifting to the future, estimates from the four analysts covering the company suggest revenue should grow by 0.3% over the next year. That's shaping up to be materially lower than the 25% growth forecast for the broader industry.
With this in consideration, its clear as to why Xperi's P/S is falling short industry peers. Apparently many shareholders weren't comfortable holding on while the company is potentially eyeing a less prosperous future.
What We Can Learn From Xperi's P/S?
Typically, we'd caution against reading too much into price-to-sales ratios when settling on investment decisions, though it can reveal plenty about what other market participants think about the company.
As expected, our analysis of Xperi's analyst forecasts confirms that the company's underwhelming revenue outlook is a major contributor to its low P/S. Shareholders' pessimism on the revenue prospects for the company seems to be the main contributor to the depressed P/S. It's hard to see the share price rising strongly in the near future under these circumstances.
You always need to take note of risks, for example - Xperi has 2 warning signs we think you should be aware of.
Of course, profitable companies with a history of great earnings growth are generally safer bets. So you may wish to see this free collection of other companies that have reasonable P/E ratios and have grown earnings strongly.
Have feedback on this article? Concerned about the content?Get in touch with us directly. Alternatively, email editorial-team (at) simplywallst.com. This article by Simply Wall St is general in nature. We provide commentary based on historical data and analyst forecasts only using an unbiased methodology and our articles are not intended to be financial advice. It does not constitute a recommendation to buy or sell any stock, and does not take account of your objectives, or your financial situation. We aim to bring you long-term focused analysis driven by fundamental data. Note that our analysis may not factor in the latest price-sensitive company announcements or qualitative material. Simply Wall St has no position in any stocks mentioned.
对这篇文章有反馈吗?担心内容吗?直接联系我们。或者,发送电子邮件给编辑组(网址为)simplywallst.com。 Simply Wall St 的这篇文章本质上是笼统的。我们仅使用公正的方法提供基于历史数据和分析师预测的评论,我们的文章并非旨在提供财务建议。它不构成买入或卖出任何股票的建议,也没有考虑到您的目标或财务状况。我们的目标是为您提供由基本数据驱动的长期重点分析。请注意,我们的分析可能不会考虑最新的价格敏感型公司公告或定性材料。华尔街只是没有持有上述任何股票的头寸。

 Taking a look back first, the company's revenue growth last year wasn't something to get excited about as it posted a disappointing decline of 2.1%. At least revenue has managed not to go completely backwards from three years ago in aggregate, thanks to the earlier period of growth. So it appears to us that the company has had a mixed result in terms of growing revenue over that time.
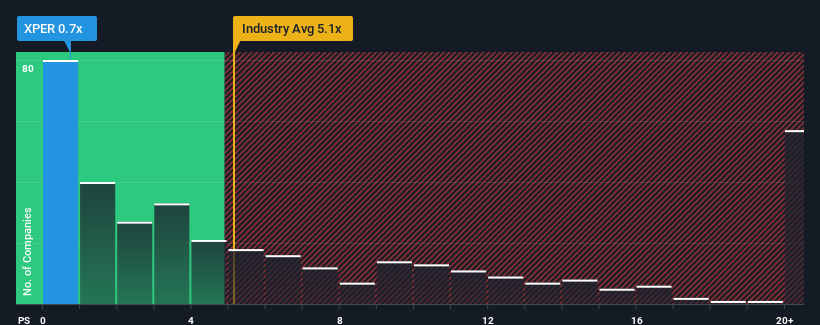
 首先回顾一下,该公司去年的收入增长并不令人兴奋,因为它公布了令人失望的2.1%的跌幅。至少由于较早的增长期,总收入没有与三年前相比完全倒退。因此,在我们看来,该公司的收入增长好坏参半。