Apple Stock Consolidates For Another Bullish Break: A Technical Analysis
Apple Stock Consolidates For Another Bullish Break: A Technical Analysis
Excitement has been building in Apple Inc’s (NASDAQ:AAPL) stock as the company nears the release of its latest iPhone 13 models. Bloomberg reports Apple’s new generation of 5G smartphones will come in four models, similar to the iPhone 12 portfolio, but will have an increased number of updates. The tech giant plans to build a record 90 million units of its next-generation iPhones by year end.
兴奋之情一直在积聚苹果公司(Apple Inc.)纳斯达克股票代码:AAPL),该公司即将发布其最新的iPhone13机型。据彭博社报道,苹果新一代5G智能手机将有四种型号,类似于iPhone 12产品组合,但更新次数将会增加。这家科技巨头计划在年底前生产创纪录的9000万部下一代iPhone。
According to CIRP data, Apple increased sales at its retail locations by 27% for the second quarter after being able to fully reopen. The agency also reported increased consumer spending has pushed customers toward more expensive iPhone models.
根据CIRP的数据,苹果在能够完全重新开业后,第二季度零售店的销售额增长了27%。该机构还报告称,消费者支出的增加推动客户转向更昂贵的iPhone机型。
Enthusiasm over the impending release helped Apple’s stock to make a blue sky run this week reaching a high of exactly $150 on Thursday.
对即将发布的这款产品的热情帮助苹果股价本周大涨,周四达到150美元的高位。
See Also: Apple Employees Say Will Be Forced To Quit iPhone Maker Over Remote-Work Crackdown: Report
另见:苹果员工表示,由于远程工作打击,将被迫退出iPhone制造商:报道
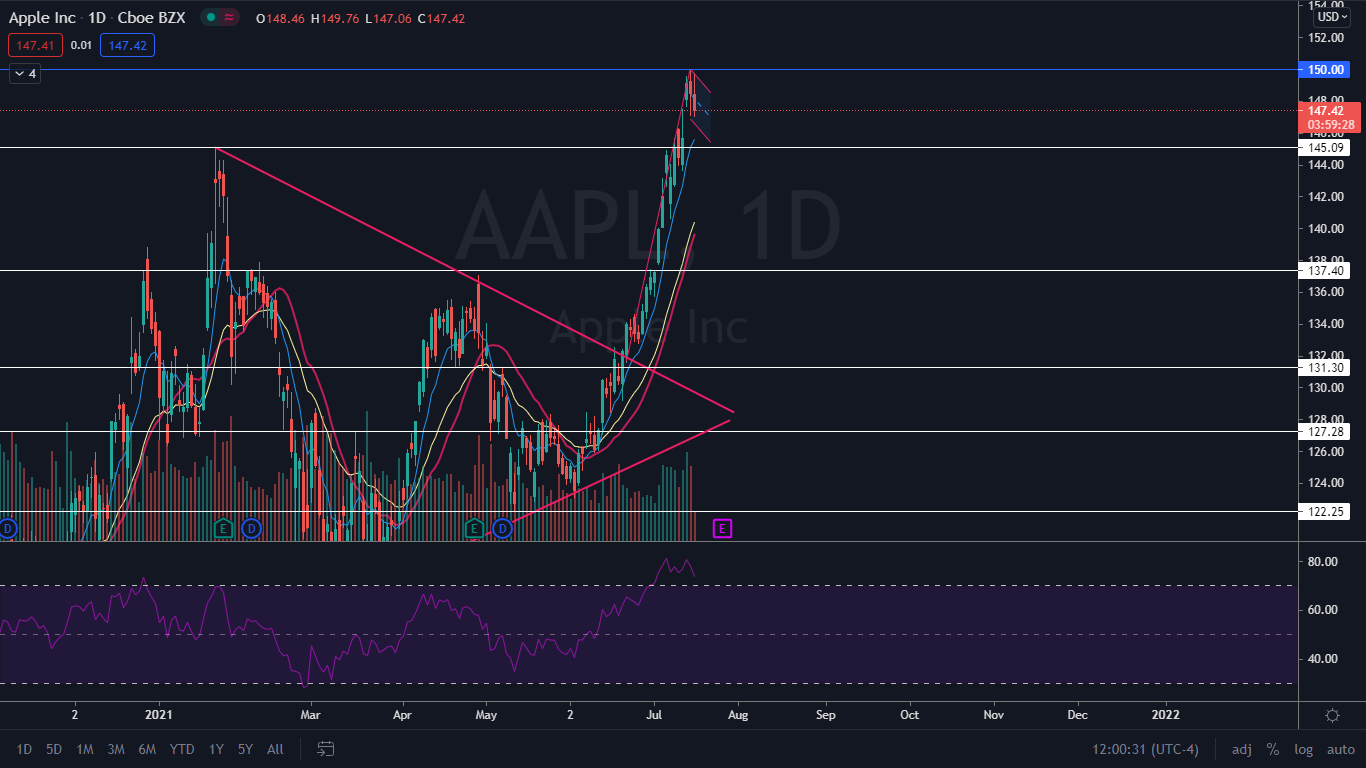
The Apple Chart: On June 22, Apple’s stock broke up from a bullish triangle on the daily chart and made a 13.53% run to a new all-time high. Apple’s stock flew through two resistance levels at the $137 and $145 levels with little difficulty before topping out at the psychological resistance level of $150.
苹果排行榜:6月22日,苹果股价从日线图上的看涨三角形中解脱出来,大涨13.53%,再创历史新高。苹果股价在突破137美元和145美元的两个阻力位后毫不费力地涨到了150美元的心理阻力位。
Since July 1 Apple’s stock has registered a relative strength index (RSI) of over 70%, which put it firmly into overbought territory. On Thursday Apple’s stock reached an RSI of just over 80%, for the second time in less than two weeks, which indicated consolidation was needed. On Friday Apple began to pull back.
自7月1日以来,苹果股票的相对强弱指数(RSI)已经超过了70%,这使得它牢牢地进入了超买区域。周四,苹果股价在不到两周的时间里第二次达到了略高于80%的RSI,这表明需要进行整合。上周五,苹果开始撤退。
The pullback in the stock could form a bull flag pattern just under the new all-time high resistance level, which would help Apple to cool its RSI and allow the moving averages to catch up to the price. Bulls would like to see Apple’s stock trade within the flag for another day or two to gather strength for another push north.
股价的回调可能会在新的历史高位阻力位下方形成牛旗形态,这将有助于苹果为其RSI降温,并让移动均线赶上价格。看涨苹果的人希望看到苹果的股票在旗帜内交易一两天,为再次向北推进积累力量。
Apple is trading above both the eight-day and 21-day exponential moving averages (EMAs), with the eight-day EMA trending above the 21-day EMA, both of which are bullish. Apple is also trading well above the 200-day simple moving average which confirms overall sentiment in the stock is bullish.
苹果目前在8日和21日指数移动均线(EMA)上方交易,其中8日均线趋势高于21日均线,两者都是看涨的。苹果的股价也远高于200日简单移动均线,这证实了该股的整体人气是看涨的。
lthough the eight-day EMA has moved up close to the share price, Apple is trading about 5% above the 21-day EMA. Further consolidation will allow for the 21-day EMA to catch up.
虽然8日均线已经上涨到接近股价的水平,但苹果的股价仍比21日均线高出约5%。进一步盘整将使21日均线能够迎头赶上。

Bulls want to see Apple’s stock eventually break up bullish from the bull flag to make another blue sky run. With earnings coming up on July 27 after markets close, Apple’s stock could run up into its earnings print.
多头希望看到苹果股票最终从牛市旗帜中脱离看涨走势,再创一波蓝天奔跑。随着7月27日股市收盘后财报的上扬,苹果的股票可能会走高,进入财报版面。
Bears want to see bearish volume drop Apple’s stock down below the flag pattern and for the stock to lose support of the eight-day EMA. If Apple were to lose the level as support it could fall back under the $145.08 mark.
看空者希望看到看跌的成交量使苹果股票跌破旗帜形态,并让该股失去对为期8天的均线的支持。如果苹果失去这一支撑水平,它可能会跌回145.08美元大关以下。
AAPL Price Action: Shares of Apple were trading down 1.5% to $146.25 at publication time.
AAPL价格操作:截至发稿时,苹果股价下跌1.5%,至146.25美元。
