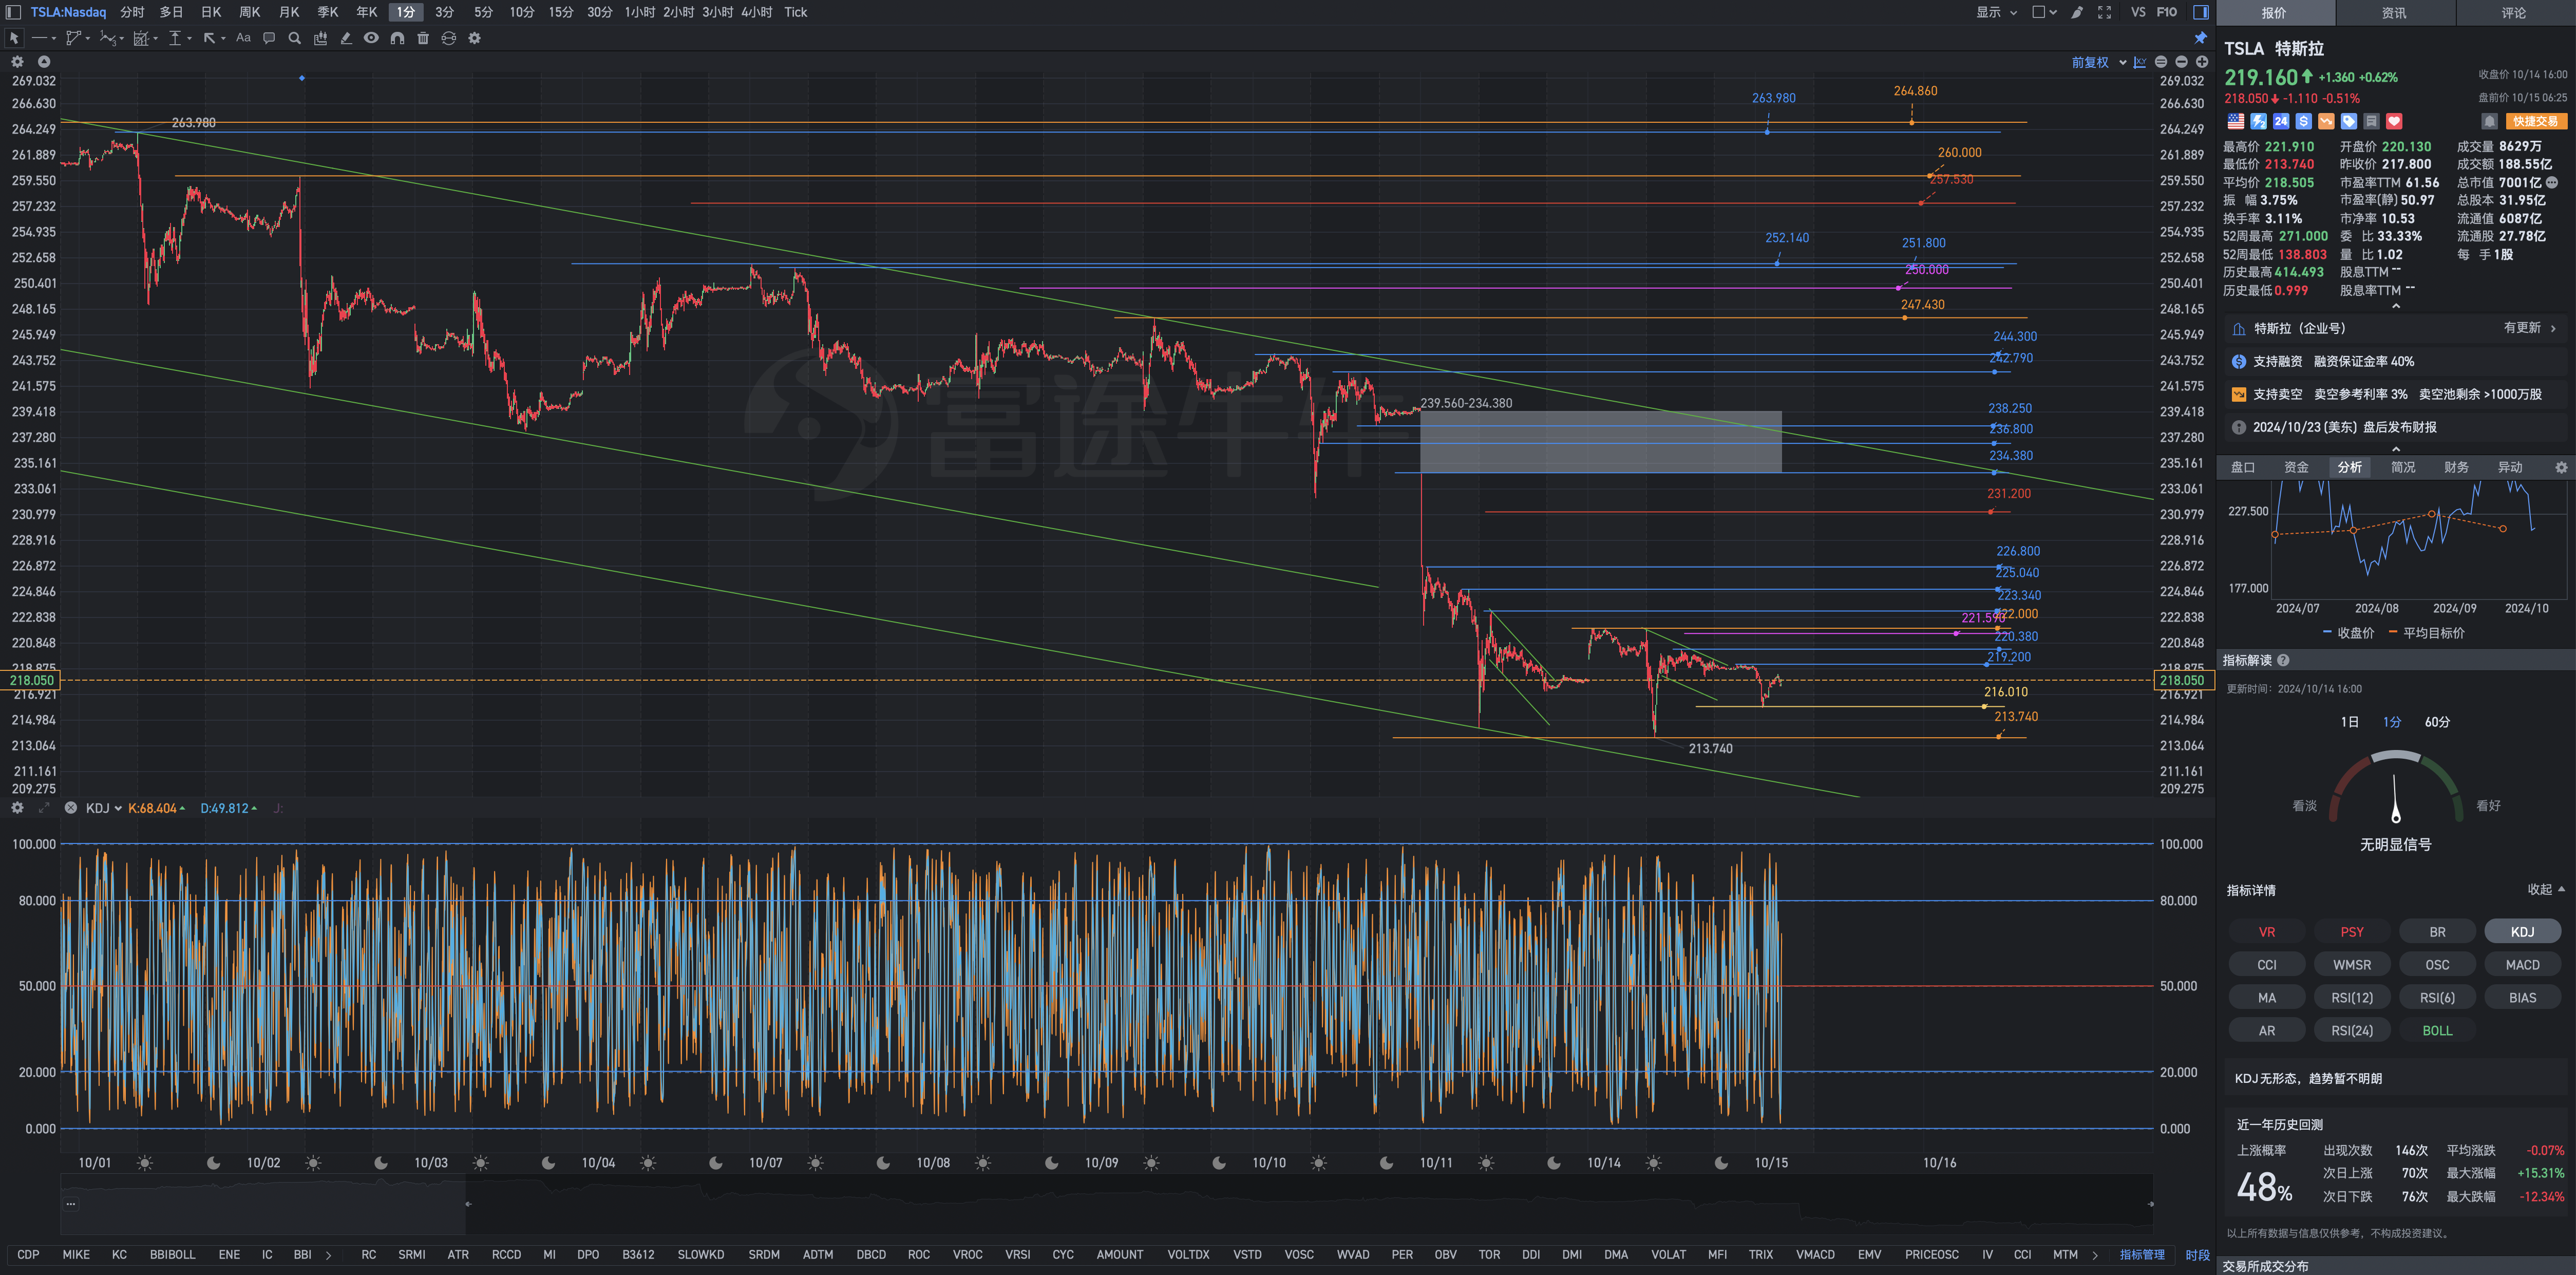
10月15日週二Tesla盤前復盤圖表解析式
行情在絕望中爆發、猶豫中上漲、歡樂中死亡。你的注意點就是你的命運。跟着蒼蠅找廁所,跟着蜜蜂找花朵,跟着千萬掙百萬,跟着乞丐會要飯。活魚逆流而上,死魚隨波逐流。沒有困難就沒有智慧。人可以忍受不幸,也可以戰勝不幸,因爲人有着驚人的潛力,只要立志發揮它,就一定能渡過難關。順境中的好運,爲人們所希冀;逆境中的好運,則爲人們所驚奇。最困難的時候,也就是離成功不遠的時候。要想捉大魚,不能怕水深。
焦慮不但是不會卸下明天的負擔,反而是會去剝奪了你今天的快樂。經歷酸甜苦辣才會更韻味悠長,或許生命中因爲有了夠多的雲翳,才能造就一個美麗的黃昏。任何一次苦難的經歷,只要不是毀滅,就是財富。上帝幫助信靠他的人。
學歷是銅牌,能力是銀牌,人脈是金牌,思維是王牌,耶穌是牌王,萬王之王。成功的人不是贏在起點,而是贏在轉折點。不要活在別人的嘴裏,不要活在別人的眼裏,而是把命運交到上帝手裏,相信他依靠他。小聰明是戰術,大智慧是戰略;小聰明看到的是芝麻,大智慧看到的是西瓜。不說硬話,不幹軟事。
留有餘地的彈性倉位管理是帳戶穩定持續增長的基本保證,是職業投機者必備能力。
能改的,叫做缺點,不能改的,叫做弱點。當你穿過了暴風雨,你就不再是原來那個人。有一個夜晚我燒燬了所有的記憶,從此我的夢就透明瞭。當上帝賜給你荒野時,就意味着,他要你成爲高飛的鷹。人們很少做他們相信是對的事,他們做比較方便的事,然後後悔。愛,是什麼都介意,又什麼都原諒。
本輪反彈的起始點是182.000,最高點是271.000。
順大勢,反技術,逆人性。
股價進入212.100–202.130區域啓動護倉基金,有計劃有步驟,分梯度分批次,離散型隨機變量,開倉佈局。
股價進入202.130–182.000區域啓動深跌重買基金,有計劃有步驟,分梯度分批次,離散型隨機變量,開倉佈局。
226.500以上就不要再建立新的好倉了。


論絕望:PSY是職業Trader必備之利器
什麼是絕望?絕望在金融市場上也是有定量分析的。那就是:心理線(PSY)指標。
心理線(PSY)指標引是研究投資者對股市漲跌產生心理波動的情緒指標。它對股市短期走勢的研判具有一定的參考意義。研究人員發現:一方面,人們的心理預期與市勢的高低成正比,即市勢升,心理預期也升,市勢跌,心理預期也跌;另一方面,當人們的心理預期接近或達到極端的時候,逆反心理開始起作用,並可能最終導致心理預期方向的逆轉。
1.一段下跌(上升)行情展開前,超買(超賣)的最高(低)點通常會出現兩次。在出現第二次超買(超賣)的最高(低)點時,一般是賣出(買進)時機。由於PSY指標具有這種高點密集出現的特性,可給投資者帶來充裕時間進行研判與介入。
2.PSY指標在25~75之間爲常態分佈。PSY指標主要反映市場心理的超買超賣,因此,當心理線指標在常態區域內上下移動時,一般應持觀望態度。
3.PSY指標超過75或低於25時,表明股價開始步入超買區或超賣區,此時需要留心其動向。當PSY指標百分比值超過83或低於17時,表明市場出現超買區或超賣區,價位回跌或回升的機會增加,投資者應該準備賣出或買進,不必在意是否出現第二次信號。這種情況在個股中比較多見。
4.當PSY指標百分比值<10,是極度超賣。搶反彈的機會相對提高,此時爲短期較佳的買進時機;反之,如果PSY指標百分比值>90,是極度超買。此時爲短期賣出的有利時機。
5.當PSY曲線和PSYMA曲線同時向上運行時,爲買入時機;相反,當PSY曲線與PSYMA曲線同時向下運行時,爲賣出時機。而當PSY曲線向上突破PSYMA曲線時,爲買入時機;相反,當PSY曲線向下跌破PSYMA曲線後,爲賣出時機。
6.當PSY曲線向上突破PSYMA曲線後,開始向下回調至PSYMA曲線,只要PSY曲線未能跌破PSYMA曲線,都表明股價屬於強勢整理。一旦PSY曲線再度返身向上時,爲買入時機;當PSY曲線和PSYMA曲線同時向上運行一段時間後,PSY曲線遠離PSYMA曲線時,一旦PSY曲線掉頭向下,說明股價上漲的動能消耗較大,爲賣出時機。
7.當PSY曲線和PSYMA曲線再度同時向上延伸時,投資者應持股待漲;當PSY曲線在PSYMA曲線下方運行時,投資者應持幣。
8.當PSY曲線和PSYMA曲線始終交織在一起,於一個波動幅度不大的空間內運動時,預示着股價處於盤整的格局中,投資者應以觀望爲主。
注意要點:
PSY指標與成交量變異率(VR)應配合使用,確定短期買賣點,可以找出每一波的高低點。另外,PSY指標最好與K線互相對照,如此更能從股價變動中了解超買或超賣的情況。
Tesla股票跌到這個階段,我在此溫馨提示閣下,好好學習和研究一下PSY(心理線指標)結合VR(成交量變異率)對自己的金融交易是非常有必要和及時的。
別不學無術:贏了去會所?輸了搬磚頭?那樣賭博太沒有出息了。賭博永遠是高消費,有驚喜,但更多的是絕望。
On despair: PSY is a must-have tool for professional traders
What is despair? Despair is also quantitatively analyzed in financial markets. That is: the Psychological Line (PSY) indicator.
The Psychological Line (PSY) index is a sentiment indicator that studies the psychological fluctuations of investors on the rise and fall of the stock market. It has certain reference significance for the research and judgment of the short-term trend of the stock market. The researchers found that: on the one hand, people's psychological expectations are proportional to the level of the market trend, that is, when the market trend rises, psychological expectations also rise, and when the market trend falls, psychological expectations also fall; on the other hand, when people's psychological expectations approach or reach At extremes, contrarian psychology kicks in and can eventually lead to a reversal of the direction of psychological expectations.
1. Before a falling (rising) market begins, the overbought (oversold) highest (low) point usually occurs twice. When there is a second overbought (oversold) highest (low) point, it is generally the time to sell (buy). Since the PSY indicator has the characteristics of such high-point intensive appearance, it can give investors plenty of time for research, judgment and intervention.
2. The PSY index is normally distributed between 25 and 75. The PSY indicator mainly reflects the overbought and oversold market psychology. Therefore, when the psychological line indicator moves up and down in the normal area, you should generally take a wait-and-see attitude.
3. When the PSY indicator exceeds 75 or is lower than 25, it indicates that the stock price begins to enter the overbought or oversold area, and you need to pay attention to its movements at this time. When the percentage value of the PSY indicator exceeds 83 or is lower than 17, it indicates that the market is in an overbought area or an oversold area, and the chance of the price falling or rebounding increases. Investors should be prepared to sell or buy, without worrying about whether there is a second signal. . This situation is more common in individual stocks.
4. When the percentage value of the PSY indicator is <10, it is extremely oversold. The chances of catching a rebound are relatively high, and this is a better short-term buying opportunity; on the contrary, if the percentage value of the PSY indicator is>90, it is extremely overbought. This is a favorable time for short-term selling.
5. When the PSY curve and the PSYMA curve run upward at the same time, it is the time to buy; on the contrary, when the PSY curve and the PSYMA curve run downward at the same time, it is the time to sell. When the PSY curve breaks the PSYMA curve upwards, it is the time to buy; on the contrary, when the PSY curve falls below the PSYMA curve, it is the time to sell.
6. When the PSY curve breaks above the PSYMA curve, it begins to pull back down to the PSYMA curve. As long as the PSY curve fails to break below the PSYMA curve, it indicates that the stock price is in a strong consolidation. Once the PSY curve turns upward again, it is time to buy; when the PSY curve and the PSYMA curve run upwards for a period of time at the same time, and the PSY curve is far from the PSYMA curve, once the PSY curve turns downward, it means that the stock price rises consumes a lot of kinetic energy. Time to sell.
7. When the PSY curve and the PSYMA curve extend upward at the same time again, investors should hold the stock to rise; when the PSY curve runs below the PSYMA curve, investors should hold the currency.
8. When the PSY curve and the PSYMA curve are always intertwined and move in a space with little fluctuation, it indicates that the stock price is in a consolidation pattern, and investors should wait and see.
Points to note:
The PSY indicator and the volume variation rate (VR) should be used together to determine short-term buying and selling points, and the high and low points of each wave can be found. In addition, the PSY indicator is best to compare with the K-line, so that it can better understand the overbought or oversold situation from the stock price change.
Tesla stock has fallen to this stage. I would like to remind you that it is very necessary and timely to study and study the PSY (psychological line indicator) combined with VR (volume variation rate) for your financial transactions.
Don't be ignorant: If you win, go to the club? Lost moving bricks? Gambling like that is too useless. Gambling is always high spending, there are surprises, but more of it is despair.
免責聲明:社區由Moomoo Technologies Inc.提供,僅用於教育目的。
更多信息
評論
登錄發表評論
