Summary
The yield curve still seems to be following the bearish timeline.
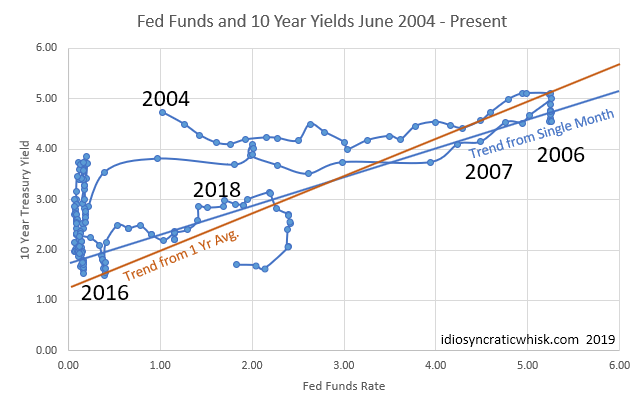
The true measure of inversion isn't a slope of zero. At the zero lower bound, it is a slope of a little more than 1% (10 year minus Fed Funds), which declines as the base yield rises.
If the Fed drops its target rate too slowly, long-term rates will tend to stabilize but not rise, and this usually ends in some sort of contraction.
If the Fed gets ahead of the dropping short-term rate, then long-term yields will pop up like they did a couple times in the 1990s, and contraction will be avoided.
The yield curve still seems to be following the bearish timeline. My axioms here are:

1) The true measure of inversion isn't a slope of zero. At the zero lower bound, it is a slope of a little more than 1% (10 year minus Fed Funds), which declines as the base yield rises. (At about 5%, meaningful inversion happens at a slope of zero, and higher than that, the slope will tend to become more negative the higher yields are.)

2) The neutral rate is a moving target. If the Fed drops its target rate too slowly, long-term rates will tend to stabilize but not rise, and this usually ends in some sort of contraction. If the Fed gets ahead of the dropping short-term rate, then long-term yields will pop up like they did a couple times in the 1990s, and contraction will be avoided. So, if the scatterplot keeps moving to the left as it did this month, that's bearish. If it moves up, that's bullish.
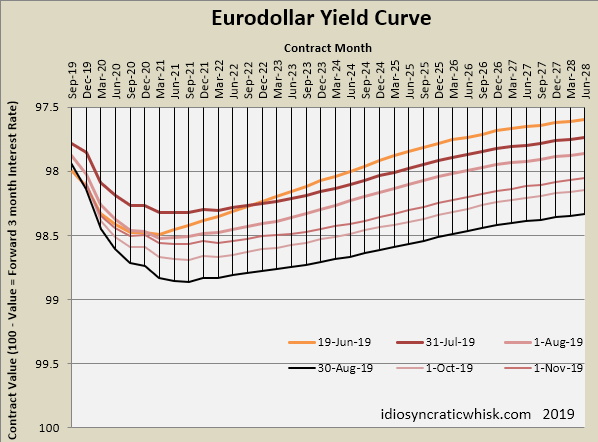
The second graph is the Eurodollar yield curve, which continues to move up and down a bit but with a negative short-term slope and a pretty flat long-term slope. I expect the short end of this curve to eventually drop below where it was in late August. It will be good news if it doesn't.
Original Post
Editor's Note: The summary bullets for this article were chosen by Seeking Alpha editors.
Summary
The yield curve still seems to be following the bearish timeline.
The true measure of inversion isn't a slope of zero. At the zero lower bound, it is a slope of a little more than 1% (10 year minus Fed Funds), which declines as the base yield rises.
反轉的真正衡量標準不是零的斜率。在零下限,它的斜率略高於1%(10年期減去聯邦基金),隨着基礎收益率的上升而下降。
If the Fed drops its target rate too slowly, long-term rates will tend to stabilize but not rise, and this usually ends in some sort of contraction.
如果美聯儲下調目標利率的速度太慢,長期利率將趨於穩定,但不會上升,這通常會以某種收縮告終。
If the Fed gets ahead of the dropping short-term rate, then long-term yields will pop up like they did a couple times in the 1990s, and contraction will be avoided.
如果美聯儲領先於下降的短期利率,那麼長期收益率將像上世紀90年代的幾次那樣飆升,收縮將被避免。
The yield curve still seems to be following the bearish timeline. My axioms here are:

1) The true measure of inversion isn't a slope of zero. At the zero lower bound, it is a slope of a little more than 1% (10 year minus Fed Funds), which declines as the base yield rises. (At about 5%, meaningful inversion happens at a slope of zero, and higher than that, the slope will tend to become more negative the higher yields are.)
1)反演的真正度量不是零的斜率。在零下限,它的斜率略高於1%(10年期減去聯邦基金),隨着基礎收益率的上升而下降。(在大約5%的情況下,有意義的反轉發生在0的斜率上,高於5%的斜率往往會變得更負,產量越高。)

2) The neutral rate is a moving target. If the Fed drops its target rate too slowly, long-term rates will tend to stabilize but not rise, and this usually ends in some sort of contraction. If the Fed gets ahead of the dropping short-term rate, then long-term yields will pop up like they did a couple times in the 1990s, and contraction will be avoided. So, if the scatterplot keeps moving to the left as it did this month, that's bearish. If it moves up, that's bullish.
2)中性利率是一個移動的目標。如果美聯儲下調目標利率的速度太慢,長期利率將趨於穩定,但不會上升,這通常會以某種收縮告終。如果美聯儲領先於下降的短期利率,那麼長期收益率將像上世紀90年代的幾次那樣飆升,收縮將被避免。因此,如果散點圖像本月那樣繼續向左移動,那就是看跌。如果上漲,那就是看漲。
The second graph is the Eurodollar yield curve, which continues to move up and down a bit but with a negative short-term slope and a pretty flat long-term slope. I expect the short end of this curve to eventually drop below where it was in late August. It will be good news if it doesn't.
第二張圖是歐洲美元收益率曲線,該曲線繼續上下移動,但短期斜率為負值,長期斜率相當平坦。我預計這條曲線的短端最終將跌破8月下旬的水平。如果不是這樣,那將是個好消息。
Editor's Note: The summary bullets for this article were chosen by Seeking Alpha editors.
編者注:本文的摘要項目符號是由尋找Alpha編輯選擇的。


