
Signet Jewelers' (NYSE:SIG) Investors Will Be Pleased With Their Fantastic 327% Return Over the Last Five Years
Signet Jewelers' (NYSE:SIG) Investors Will Be Pleased With Their Fantastic 327% Return Over the Last Five Years
 During the last half decade, Signet Jewelers became profitable. That kind of transition can be an inflection point that justifies a strong share price gain, just as we have seen here.
 The most you can lose on any stock (assuming you don't use leverage) is 100% of your money. But on a lighter note, a good company can see its share price rise well over 100%. For instance, the price of Signet Jewelers Limited (NYSE:SIG) stock is up an impressive 285% over the last five years. It's also good to see the share price up 41% over the last quarter.
任何股票(假設你不使用槓桿)的最大損失是你的資金的100%。但簡而言之,一家好的公司的股價可以上漲超過100%。例如,Signet Jewelers Limited(紐約證券交易所代碼:SIG)的股票價格在過去五年中上漲了令人印象深刻的285%。股價在上個季度上漲了41%也是件好事。
With that in mind, it's worth seeing if the company's underlying fundamentals have been the driver of long term performance, or if there are some discrepancies.
考慮到這一點,值得一看公司的基本面是否是長期業績的驅動力,或者是否存在一些差異。
While the efficient markets hypothesis continues to be taught by some, it has been proven that markets are over-reactive dynamic systems, and investors are not always rational. One imperfect but simple way to consider how the market perception of a company has shifted is to compare the change in the earnings per share (EPS) with the share price movement.
儘管一些人繼續教導高效市場假說,但事實證明,市場是反應過度的動態系統,投資者並不總是理性的。考慮市場對公司的看法發生了怎樣的變化的一種不完美但簡單的方法是將每股收益(EPS)的變化與股價走勢進行比較。
During the last half decade, Signet Jewelers became profitable. That kind of transition can be an inflection point that justifies a strong share price gain, just as we have seen here.
在過去的五年中,Signet Jewelers實現了盈利。正如我們在這裏看到的那樣,這種轉變可能是一個轉折點,可以證明股價的強勁上漲是合理的。
You can see how EPS has changed over time in the image below (click on the chart to see the exact values).
您可以在下圖中看到 EPS 隨時間推移的變化(點擊圖表查看確切值)。
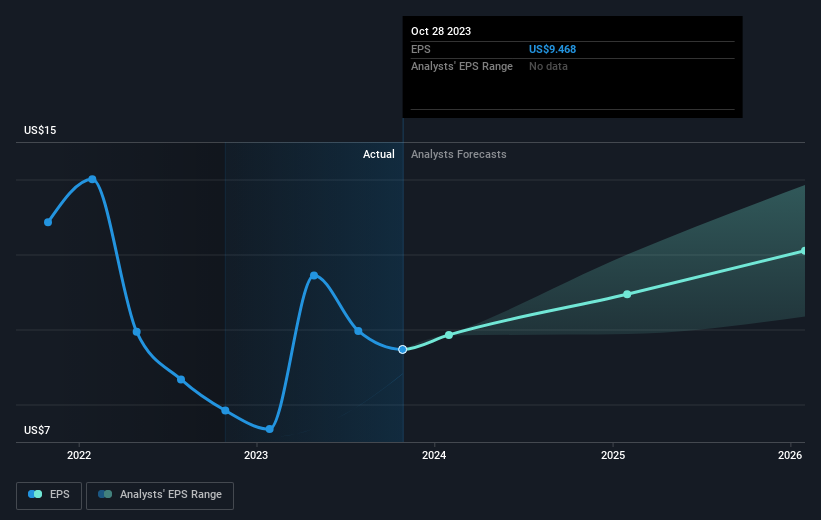
We know that Signet Jewelers has improved its bottom line over the last three years, but what does the future have in store? If you are thinking of buying or selling Signet Jewelers stock, you should check out this FREE detailed report on its balance sheet.
我們知道Signet Jewelers在過去三年中提高了利潤,但是未來會怎樣?如果你想買入或賣出Signet Jewelers的股票,你應該查看這份關於其資產負債表的免費詳細報告。
What About Dividends?
分紅呢?
When looking at investment returns, it is important to consider the difference between total shareholder return (TSR) and share price return. The TSR incorporates the value of any spin-offs or discounted capital raisings, along with any dividends, based on the assumption that the dividends are reinvested. It's fair to say that the TSR gives a more complete picture for stocks that pay a dividend. In the case of Signet Jewelers, it has a TSR of 327% for the last 5 years. That exceeds its share price return that we previously mentioned. And there's no prize for guessing that the dividend payments largely explain the divergence!
在考慮投資回報時,重要的是要考慮兩者之間的區別 股東總回報 (TSR) 和 股價回報。股東總回報率包含任何分拆或貼現資本籌集的價值,以及任何股息,前提是股息是再投資的。可以公平地說,股東總回報率爲支付股息的股票提供了更完整的畫面。就Signet Jewelers而言,在過去的5年中,其股東總回報率爲327%。這超過了我們之前提到的其股價回報率。而且,猜測股息支付在很大程度上解釋了這種分歧是沒有好處的!
A Different Perspective
不同的視角
We're pleased to report that Signet Jewelers shareholders have received a total shareholder return of 29% over one year. And that does include the dividend. However, that falls short of the 34% TSR per annum it has made for shareholders, each year, over five years. Before spending more time on Signet Jewelers it might be wise to click here to see if insiders have been buying or selling shares.
我們很高興地向大家報告,Signet Jewelers的股東在一年內獲得了29%的總股東回報率。這確實包括股息。但是,這低於其在五年內每年爲股東創造的34%的股東總回報率。在花更多時間購買Signet Jewelers之前,明智的做法可能是點擊此處查看內部人士是否在買入或賣出股票。
Of course, you might find a fantastic investment by looking elsewhere. So take a peek at this free list of companies we expect will grow earnings.
當然,通過尋找其他地方,你可能會找到一筆不錯的投資。因此,請看一下我們預計收益將增加的這份免費公司名單。
Please note, the market returns quoted in this article reflect the market weighted average returns of stocks that currently trade on American exchanges.
請注意,本文引用的市場回報反映了目前在美國交易所交易的股票的市場加權平均回報。
Have feedback on this article? Concerned about the content? Get in touch with us directly. Alternatively, email editorial-team (at) simplywallst.com.
This article by Simply Wall St is general in nature. We provide commentary based on historical data and analyst forecasts only using an unbiased methodology and our articles are not intended to be financial advice. It does not constitute a recommendation to buy or sell any stock, and does not take account of your objectives, or your financial situation. We aim to bring you long-term focused analysis driven by fundamental data. Note that our analysis may not factor in the latest price-sensitive company announcements or qualitative material. Simply Wall St has no position in any stocks mentioned.
對這篇文章有反饋嗎?對內容感到擔憂?直接聯繫我們。 或者,給編輯團隊 (at) simplywallst.com 發送電子郵件。
Simply Wall St的這篇文章本質上是籠統的。我們僅使用公正的方法根據歷史數據和分析師的預測提供評論,我們的文章無意作爲財務建議。它不構成買入或賣出任何股票的建議,也沒有考慮到您的目標或財務狀況。我們的目標是爲您提供由基本數據驅動的長期重點分析。請注意,我們的分析可能不考慮最新的價格敏感型公司公告或定性材料。簡而言之,華爾街沒有持有任何上述股票的頭寸。
