
Capital Allocation Trends At Zhejiang Taihua New MaterialLtd (SHSE:603055) Aren't Ideal
Capital Allocation Trends At Zhejiang Taihua New MaterialLtd (SHSE:603055) Aren't Ideal
 0.029 = CN¥202m ÷ (CN¥9.8b - CN¥2.8b) (Based on the trailing twelve months to September 2023).
What are the early trends we should look for to identify a stock that could multiply in value over the long term? Firstly, we'll want to see a proven return on capital employed (ROCE) that is increasing, and secondly, an expanding base of capital employed. This shows us that it's a compounding machine, able to continually reinvest its earnings back into the business and generate higher returns. Although, when we looked at Zhejiang Taihua New MaterialLtd (SHSE:603055), it didn't seem to tick all of these boxes.
我們應該尋找哪些早期趨勢來確定一隻可能長期價值成倍增長的股票?首先,我們希望看到經過驗證的 返回 關於正在增加的資本使用率(ROCE),其次是擴大 基礎 所用資本的比例。這向我們表明,它是一臺複合機器,能夠持續將其收益再投資到業務中併產生更高的回報。但是,當我們查看浙江泰華新材料有限公司(SHSE: 603055)時,它似乎並沒有勾選所有這些方框。
What Is Return On Capital Employed (ROCE)?
什麼是資本使用回報率(ROCE)?
If you haven't worked with ROCE before, it measures the 'return' (pre-tax profit) a company generates from capital employed in its business. The formula for this calculation on Zhejiang Taihua New MaterialLtd is:
如果你以前沒有與ROCE合作過,它會衡量公司從其業務中使用的資本中產生的 “回報”(稅前利潤)。浙江臺華新材料有限公司的計算公式爲:
Return on Capital Employed = Earnings Before Interest and Tax (EBIT) ÷ (Total Assets - Current Liabilities)
已動用資本回報率 = 息稅前收益 (EBIT) ¥(總資產-流動負債)
0.029 = CN¥202m ÷ (CN¥9.8b - CN¥2.8b) (Based on the trailing twelve months to September 2023).
0.029 = 2.02億元人民幣 ÷(98億元人民幣-28億元人民幣) (基於截至2023年9月的過去十二個月)。
Therefore, Zhejiang Taihua New MaterialLtd has an ROCE of 2.9%. In absolute terms, that's a low return and it also under-performs the Luxury industry average of 5.4%.
因此,浙江泰華新材料有限公司的投資回報率爲2.9%。從絕對值來看,這是一個低迴報,其表現也低於奢侈品行業5.4%的平均水平。
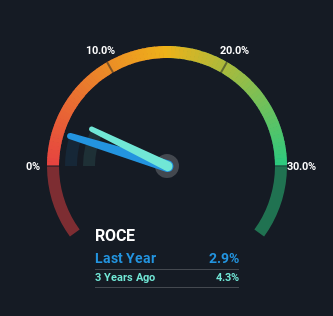
Above you can see how the current ROCE for Zhejiang Taihua New MaterialLtd compares to its prior returns on capital, but there's only so much you can tell from the past. If you'd like, you can check out the forecasts from the analysts covering Zhejiang Taihua New MaterialLtd for free.
上面你可以看到浙江泰華新材料有限公司當前的投資回報率與其先前的資本回報率相比如何,但從過去可以看出來的只有那麼多。如果您願意,可以免費查看報道浙江臺華新材料有限公司的分析師的預測。
The Trend Of ROCE
ROCE 的趨勢
In terms of Zhejiang Taihua New MaterialLtd's historical ROCE movements, the trend isn't fantastic. Over the last five years, returns on capital have decreased to 2.9% from 19% five years ago. Meanwhile, the business is utilizing more capital but this hasn't moved the needle much in terms of sales in the past 12 months, so this could reflect longer term investments. It's worth keeping an eye on the company's earnings from here on to see if these investments do end up contributing to the bottom line.
就浙江泰華新材有限公司的歷史ROCE走勢而言,這一趨勢並不理想。在過去五年中,資本回報率從五年前的19%下降到2.9%。同時,該業務正在使用更多的資本,但在過去的12個月中,這並沒有對銷售產生太大影響,因此這可能反映出長期投資。從現在起,值得關注公司的收益,看看這些投資最終是否確實爲利潤做出了貢獻。
In Conclusion...
總之...
To conclude, we've found that Zhejiang Taihua New MaterialLtd is reinvesting in the business, but returns have been falling. Unsurprisingly, the stock has only gained 17% over the last five years, which potentially indicates that investors are accounting for this going forward. As a result, if you're hunting for a multi-bagger, we think you'd have more luck elsewhere.
總而言之,我們發現浙江泰華新材料有限公司正在對該業務進行再投資,但回報率一直在下降。毫不奇怪,該股在過去五年中僅上漲了17%,這可能表明投資者正在考慮未來的情況。因此,如果你正在尋找一臺多袋裝機,我們認爲你在其他地方會有更多的運氣。
One more thing: We've identified 3 warning signs with Zhejiang Taihua New MaterialLtd (at least 2 which are significant) , and understanding these would certainly be useful.
還有一件事:我們已經確定了浙江泰華新材料有限公司的3個警告標誌(至少有2個是重要的),了解這些信號肯定會很有用。
For those who like to invest in solid companies, check out this free list of companies with solid balance sheets and high returns on equity.
對於那些喜歡投資穩健公司的人,可以查看這份資產負債表穩健和股本回報率高的公司的免費清單。
Have feedback on this article? Concerned about the content? Get in touch with us directly. Alternatively, email editorial-team (at) simplywallst.com.
This article by Simply Wall St is general in nature. We provide commentary based on historical data and analyst forecasts only using an unbiased methodology and our articles are not intended to be financial advice. It does not constitute a recommendation to buy or sell any stock, and does not take account of your objectives, or your financial situation. We aim to bring you long-term focused analysis driven by fundamental data. Note that our analysis may not factor in the latest price-sensitive company announcements or qualitative material. Simply Wall St has no position in any stocks mentioned.
對這篇文章有反饋嗎?對內容感到擔憂?直接聯繫我們。 或者,給編輯團隊 (at) simplywallst.com 發送電子郵件。
Simply Wall St的這篇文章本質上是籠統的。我們僅使用公正的方法根據歷史數據和分析師的預測提供評論,我們的文章無意作爲財務建議。它不構成買入或賣出任何股票的建議,也沒有考慮到您的目標或財務狀況。我們的目標是爲您提供由基本數據驅動的長期重點分析。請注意,我們的分析可能不考慮最新的價格敏感型公司公告或定性材料。簡而言之,華爾街沒有持有任何上述股票的頭寸。
