
Shangri-La Asia (HKG:69) Investors Are Sitting on a Loss of 41% If They Invested Five Years Ago
Shangri-La Asia (HKG:69) Investors Are Sitting on a Loss of 41% If They Invested Five Years Ago
While it may not be enough for some shareholders, we think it is good to see the Shangri-La Asia Limited (HKG:69) share price up 12% in a single quarter. But over the last half decade, the stock has not performed well. In fact, the share price is down 42%, which falls well short of the return you could get by buying an index fund.
儘管這對某些股東來說可能還不夠,但我們認爲香格里拉亞洲有限公司(HKG: 69)股價在單季度內上漲12%是件好事。但是在過去的五年中,該股表現不佳。實際上,股價下跌了42%,遠低於購買指數基金所能獲得的回報。
Now let's have a look at the company's fundamentals, and see if the long term shareholder return has matched the performance of the underlying business.
現在讓我們來看看公司的基本面,看看長期股東回報是否與基礎業務的表現相匹配。
To paraphrase Benjamin Graham: Over the short term the market is a voting machine, but over the long term it's a weighing machine. One imperfect but simple way to consider how the market perception of a company has shifted is to compare the change in the earnings per share (EPS) with the share price movement.
用本傑明·格雷厄姆的話來說:從短期來看,市場是一臺投票機器,但從長遠來看,它是一臺稱重機。考慮市場對公司的看法發生了怎樣的變化的一種不完美但簡單的方法是將每股收益(EPS)的變化與股價走勢進行比較。
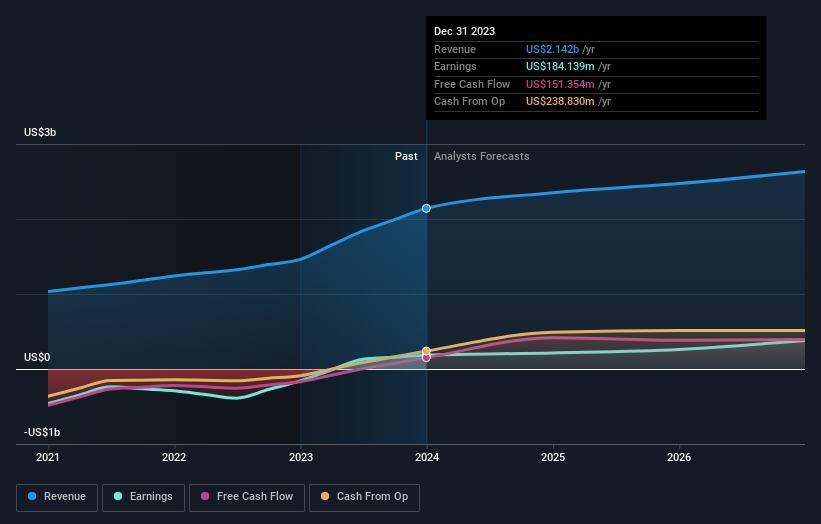
During five years of share price growth, Shangri-La Asia moved from a loss to profitability. Most would consider that to be a good thing, so it's counter-intuitive to see the share price declining. Other metrics may better explain the share price move.
在五年的股價增長中,香格里拉亞洲從虧損轉爲盈利。大多數人會認爲這是一件好事,因此股價下跌是違反直覺的。其他指標可以更好地解釋股價走勢。
It could be that the revenue decline of 9.1% per year is viewed as evidence that Shangri-La Asia is shrinking. This has probably encouraged some shareholders to sell down the stock.
每年9.1%的收入下降可能被視爲亞洲香格里拉正在萎縮的證據。這可能鼓勵了一些股東拋售該股。
The image below shows how earnings and revenue have tracked over time (if you click on the image you can see greater detail).
下圖顯示了收入和收入隨時間推移的跟蹤情況(如果您點擊圖片,可以看到更多細節)。
We like that insiders have been buying shares in the last twelve months. Having said that, most people consider earnings and revenue growth trends to be a more meaningful guide to the business. This free report showing analyst forecasts should help you form a view on Shangri-La Asia
像我們一樣,內部人士在過去的十二個月中一直在購買股票。話雖如此,大多數人認爲收益和收入增長趨勢是更有意義的業務指南。這份顯示分析師預測的免費報告將幫助您形成對亞洲香格里拉的看法
A Different Perspective
不同的視角
Investors in Shangri-La Asia had a tough year, with a total loss of 15% (including dividends), against a market gain of about 6.5%. However, keep in mind that even the best stocks will sometimes underperform the market over a twelve month period. Unfortunately, last year's performance may indicate unresolved challenges, given that it was worse than the annualised loss of 7% over the last half decade. Generally speaking long term share price weakness can be a bad sign, though contrarian investors might want to research the stock in hope of a turnaround. It's always interesting to track share price performance over the longer term. But to understand Shangri-La Asia better, we need to consider many other factors. Take risks, for example - Shangri-La Asia has 1 warning sign we think you should be aware of.
亞洲香格里拉的投資者經歷了艱難的一年,總虧損了15%(包括股息),而市場漲幅約爲6.5%。但是,請記住,即使是最好的股票有時也會在十二個月內表現不如市場。不幸的是,去年的表現可能預示着尚未解決的挑戰,因爲它比過去五年中7%的年化虧損還要糟糕。總的來說,長期股價疲軟可能是一個壞兆頭,儘管逆勢投資者可能希望研究該股以期出現轉機。長期跟蹤股價表現總是很有意思的。但是,爲了更好地了解亞洲香格里拉,我們需要考慮許多其他因素。舉個例子,冒險吧——亞洲香格里拉有一個警告信號,我們認爲你應該注意。
If you like to buy stocks alongside management, then you might just love this free list of companies. (Hint: most of them are flying under the radar).
如果你想和管理層一起購買股票,那麼你可能會喜歡這份免費的公司清單。(提示:它們中的大多數都在雷達下飛行)。
Please note, the market returns quoted in this article reflect the market weighted average returns of stocks that currently trade on Hong Kong exchanges.
請注意,本文引用的市場回報反映了目前在香港交易所交易的股票的市場加權平均回報。
Have feedback on this article? Concerned about the content? Get in touch with us directly. Alternatively, email editorial-team (at) simplywallst.com.
This article by Simply Wall St is general in nature. We provide commentary based on historical data and analyst forecasts only using an unbiased methodology and our articles are not intended to be financial advice. It does not constitute a recommendation to buy or sell any stock, and does not take account of your objectives, or your financial situation. We aim to bring you long-term focused analysis driven by fundamental data. Note that our analysis may not factor in the latest price-sensitive company announcements or qualitative material. Simply Wall St has no position in any stocks mentioned.
對這篇文章有反饋嗎?對內容感到擔憂?直接聯繫我們。 或者,給編輯團隊 (at) simplywallst.com 發送電子郵件。
Simply Wall St的這篇文章本質上是籠統的。我們僅使用公正的方法根據歷史數據和分析師的預測提供評論,我們的文章無意作爲財務建議。它不構成買入或賣出任何股票的建議,也沒有考慮到您的目標或財務狀況。我們的目標是爲您提供由基本數據驅動的長期重點分析。請注意,我們的分析可能不考慮最新的價格敏感型公司公告或定性材料。簡而言之,華爾街沒有持有任何上述股票的頭寸。