Tian Cheng Holdings Limited (HKG:2110) shares have had a horrible month, losing 32% after a relatively good period beforehand. For any long-term shareholders, the last month ends a year to forget by locking in a 72% share price decline.
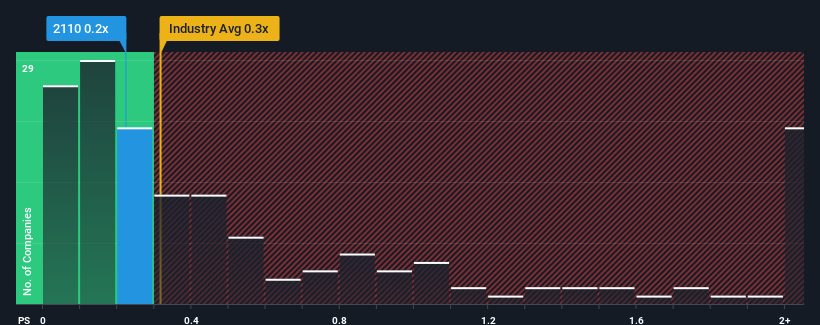
Although its price has dipped substantially, it's still not a stretch to say that Tian Cheng Holdings' price-to-sales (or "P/S") ratio of 0.2x right now seems quite "middle-of-the-road" compared to the Construction industry in Hong Kong, where the median P/S ratio is around 0.3x. However, investors might be overlooking a clear opportunity or potential setback if there is no rational basis for the P/S.
SEHK:2110 Price to Sales Ratio vs Industry May 30th 2024
What Does Tian Cheng Holdings' P/S Mean For Shareholders?
For instance, Tian Cheng Holdings' receding revenue in recent times would have to be some food for thought. Perhaps investors believe the recent revenue performance is enough to keep in line with the industry, which is keeping the P/S from dropping off. If not, then existing shareholders may be a little nervous about the viability of the share price.
Although there are no analyst estimates available for Tian Cheng Holdings, take a look at this free data-rich visualisation to see how the company stacks up on earnings, revenue and cash flow.
How Is Tian Cheng Holdings' Revenue Growth Trending?
Tian Cheng Holdings' P/S ratio would be typical for a company that's only expected to deliver moderate growth, and importantly, perform in line with the industry.
In reviewing the last year of financials, we were disheartened to see the company's revenues fell to the tune of 12%. The last three years don't look nice either as the company has shrunk revenue by 36% in aggregate. Accordingly, shareholders would have felt downbeat about the medium-term rates of revenue growth.
In contrast to the company, the rest of the industry is expected to grow by 11% over the next year, which really puts the company's recent medium-term revenue decline into perspective.
With this information, we find it concerning that Tian Cheng Holdings is trading at a fairly similar P/S compared to the industry. It seems most investors are ignoring the recent poor growth rate and are hoping for a turnaround in the company's business prospects. There's a good chance existing shareholders are setting themselves up for future disappointment if the P/S falls to levels more in line with the recent negative growth rates.
What We Can Learn From Tian Cheng Holdings' P/S?
Tian Cheng Holdings' plummeting stock price has brought its P/S back to a similar region as the rest of the industry. Generally, our preference is to limit the use of the price-to-sales ratio to establishing what the market thinks about the overall health of a company.
We find it unexpected that Tian Cheng Holdings trades at a P/S ratio that is comparable to the rest of the industry, despite experiencing declining revenues during the medium-term, while the industry as a whole is expected to grow. Even though it matches the industry, we're uncomfortable with the current P/S ratio, as this dismal revenue performance is unlikely to support a more positive sentiment for long. Unless the the circumstances surrounding the recent medium-term improve, it wouldn't be wrong to expect a a difficult period ahead for the company's shareholders.
It's always necessary to consider the ever-present spectre of investment risk. We've identified 4 warning signs with Tian Cheng Holdings (at least 3 which are a bit unpleasant), and understanding these should be part of your investment process.
Of course, profitable companies with a history of great earnings growth are generally safer bets. So you may wish to see this free collection of other companies that have reasonable P/E ratios and have grown earnings strongly.
Have feedback on this article? Concerned about the content?Get in touch with us directly. Alternatively, email editorial-team (at) simplywallst.com. This article by Simply Wall St is general in nature. We provide commentary based on historical data and analyst forecasts only using an unbiased methodology and our articles are not intended to be financial advice. It does not constitute a recommendation to buy or sell any stock, and does not take account of your objectives, or your financial situation. We aim to bring you long-term focused analysis driven by fundamental data. Note that our analysis may not factor in the latest price-sensitive company announcements or qualitative material. Simply Wall St has no position in any stocks mentioned.