
Hengan International Group (HKG:1044) Sheds HK$988m, Company Earnings and Investor Returns Have Been Trending Downwards for Past Five Years
Hengan International Group (HKG:1044) Sheds HK$988m, Company Earnings and Investor Returns Have Been Trending Downwards for Past Five Years
The main aim of stock picking is to find the market-beating stocks. But in any portfolio, there will be mixed results between individual stocks. So we wouldn't blame long term Hengan International Group Company Limited (HKG:1044) shareholders for doubting their decision to hold, with the stock down 57% over a half decade. And it's not just long term holders hurting, because the stock is down 27% in the last year. Unfortunately the share price momentum is still quite negative, with prices down 13% in thirty days.
選股的主要目標是尋找市場領先的股票。但在任何一個組合中,個別股票之間將會有混合的結果。因此,如果持有亨氏國際集團有限公司(HKG:1044)的長期股東對他們的持有決策有所懷疑,股票在半個十年中下跌了57%,我們不會責怪他們。而且不僅是長揸者在受苦,因爲股票在過去一年中下跌了27%。不幸的是,股價動能仍然非常消極,在30天內下降了13%。
After losing 3.5% this past week, it's worth investigating the company's fundamentals to see what we can infer from past performance.
在過去的一週中損失了3.5%後,值得調查該公司的基本面,以了解我們可以從過去的表現中推斷出什麼。
While the efficient markets hypothesis continues to be taught by some, it has been proven that markets are over-reactive dynamic systems, and investors are not always rational. One imperfect but simple way to consider how the market perception of a company has shifted is to compare the change in the earnings per share (EPS) with the share price movement.
雖然一些人仍然相信有效市場假說,但已經證明市場是過度反應的動態系統,投資者並不總是理性的。一個不完美但簡單的方法來考慮公司市場看法的變化是比較每股收益(EPS)的變化和股價的波動。
During the five years over which the share price declined, Hengan International Group's earnings per share (EPS) dropped by 5.2% each year. Readers should note that the share price has fallen faster than the EPS, at a rate of 16% per year, over the period. So it seems the market was too confident about the business, in the past. The less favorable sentiment is reflected in its current P/E ratio of 9.11.
在股價下跌的五年中,亨氏國際集團的每股收益(EPS)每年下降了5.2%。讀者應該注意,股價下跌速度快於EPS,這一速度在該時期內爲16%。所以,在過去,市場對企業過於自信。這種較不利的情續體現在其當前的市盈率爲9.11。
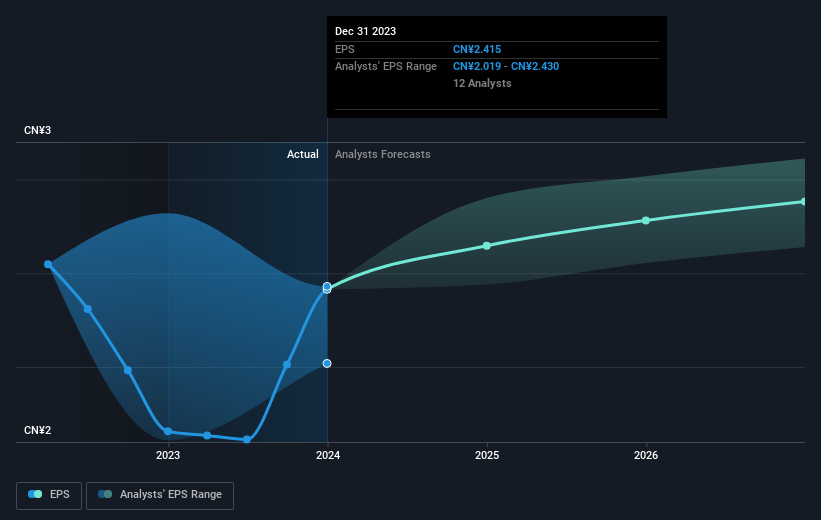
The graphic below depicts how EPS has changed over time (unveil the exact values by clicking on the image).
下圖顯示了EPS隨時間變化的情況(點擊圖像以顯示確切值)。
We like that insiders have been buying shares in the last twelve months. Even so, future earnings will be far more important to whether current shareholders make money. Dive deeper into the earnings by checking this interactive graph of Hengan International Group's earnings, revenue and cash flow.
我們很喜歡內部人士在過去十二個月中購買股票。即使如此,未來收益更爲重要,決定當前股東是否能賺錢。通過查看亨氏國際集團的收益、營業收入和現金流的交互式圖表,深入挖掘收益情況。
What About Dividends?
那麼分紅怎麼樣呢?
When looking at investment returns, it is important to consider the difference between total shareholder return (TSR) and share price return. The TSR is a return calculation that accounts for the value of cash dividends (assuming that any dividend received was reinvested) and the calculated value of any discounted capital raisings and spin-offs. So for companies that pay a generous dividend, the TSR is often a lot higher than the share price return. We note that for Hengan International Group the TSR over the last 5 years was -45%, which is better than the share price return mentioned above. This is largely a result of its dividend payments!
在考慮投資回報時,重要的是考慮總股東回報(TSR)和股票回報之間的差異。 TSR包括任何剝離或折讓的資本籌集(基於股息被重新投資的假設),以及任何股息。因此,對於支付慷慨的股息公司而言,TSR通常比股票回報高得多。就中國神威藥業集團而言,其TSR在過去5年中達到了75%。這超過了我們之前提到的股票回報。該公司支付的股息已經提高了總股東回報。總股東回報和股票回報TSR是一個回報計算,考慮到現金分紅的價值(假設任何收到的股息都被再投資)和任何折價的股本增發和分拆的計算價值。因此,對於那些支付慷慨的股息的公司,TSR通常要比股價回報要高得多。我們注意到,亨氏國際集團在過去的5年中,TSR爲-45%,比上述股票回報要好。這主要是股息支出的結果!
A Different Perspective
不同的觀點
Hengan International Group shareholders are down 23% for the year (even including dividends), but the market itself is up 3.6%. Even the share prices of good stocks drop sometimes, but we want to see improvements in the fundamental metrics of a business, before getting too interested. Unfortunately, last year's performance may indicate unresolved challenges, given that it was worse than the annualised loss of 8% over the last half decade. We realise that Baron Rothschild has said investors should "buy when there is blood on the streets", but we caution that investors should first be sure they are buying a high quality business. I find it very interesting to look at share price over the long term as a proxy for business performance. But to truly gain insight, we need to consider other information, too. Consider risks, for instance. Every company has them, and we've spotted 1 warning sign for Hengan International Group you should know about.
亨氏國際集團的股東在今年已經下跌了23%(包括股息),但市場本身上漲了3.6%。即使好股票的股價有時也會下跌,但我們希望在對業務的基本指標有所改善之前,股票表現有所提高。不幸的是,去年的表現可能表明仍存在未解決的挑戰,因爲它比過去半個十年的年化損失8%還要糟糕。我們認識到巴倫·羅斯柴爾德曾說過投資者應該在“街頭有流血時買進”,但我們提醒投資者,首先必須確定他們正在購買高質量的企業。我認爲從長期來看,股價是業務表現的一個代理。但爲了真正獲得洞察力,我們需要考慮其他信息。比如考慮風險。每家公司都有風險,我們已經發現亨氏國際集團的1個警告信號,你需要知道。
Hengan International Group is not the only stock that insiders are buying. For those who like to find lesser know companies this free list of growing companies with recent insider purchasing, could be just the ticket.
亨氏國際集團不是唯一一家內部人士購買的公司。對於那些喜歡發現較小的公司的人,最近進行內部人士購買的快速增長公司的免費清單可能正是你要找的。
Please note, the market returns quoted in this article reflect the market weighted average returns of stocks that currently trade on Hong Kong exchanges.
請注意,本文引用的市場回報反映了當前在香港證券交易所交易的股票的市場加權平均回報。
Have feedback on this article? Concerned about the content? Get in touch with us directly. Alternatively, email editorial-team (at) simplywallst.com.
This article by Simply Wall St is general in nature. We provide commentary based on historical data and analyst forecasts only using an unbiased methodology and our articles are not intended to be financial advice. It does not constitute a recommendation to buy or sell any stock, and does not take account of your objectives, or your financial situation. We aim to bring you long-term focused analysis driven by fundamental data. Note that our analysis may not factor in the latest price-sensitive company announcements or qualitative material. Simply Wall St has no position in any stocks mentioned.
對本文有反饋?關於內容有所顧慮?直接和我們聯繫。或者,發送電子郵件至editorial-team (at) simplywallst.com。
這篇文章是Simply Wall St的一般性文章。我們根據歷史數據和分析師預測提供評論,只使用公正的方法論,我們的文章並不意味着提供任何金融建議。文章不構成買賣任何股票的建議,也不考慮您的目標或您的財務狀況。我們的目標是帶給您基本數據驅動的長期關注分析。請注意,我們的分析可能不考慮最新的價格敏感公司公告或定性材料。Simply Wall St沒有任何股票頭寸。
Have feedback on this article? Concerned about the content? Get in touch with us directly. Alternatively, email editorial-team@simplywallst.com
對本文有反饋?關於內容有所顧慮?直接和我們聯繫。或者發送電子郵件至editorial-team@simplywallst.com。