
Calculating The Intrinsic Value Of Shopify Inc. (NYSE:SHOP)
Calculating The Intrinsic Value Of Shopify Inc. (NYSE:SHOP)
Key Insights
主要見解
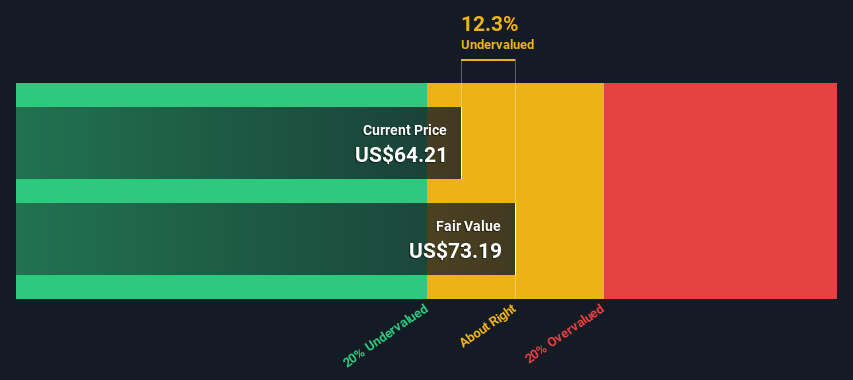
- The projected fair value for Shopify is US$73.19 based on 2 Stage Free Cash Flow to Equity
- Current share price of US$64.21 suggests Shopify is potentially trading close to its fair value
- Analyst price target for SHOP is US$76.54, which is 4.6% above our fair value estimate
- 根據2階段自由現金流到股權的預測公平價值,Shopify的預期公平價值爲73.19美元
- 當前的股票價格爲64.21美元,表明Shopify的交易價格接近其公正價值
- SHOP的分析師價值目標爲76.54美元,比我們的公正價值估計高4.6%
Today we will run through one way of estimating the intrinsic value of Shopify Inc. (NYSE:SHOP) by estimating the company's future cash flows and discounting them to their present value. Our analysis will employ the Discounted Cash Flow (DCF) model. It may sound complicated, but actually it is quite simple!
今天我們將通過估計公司未來現金流並將它們貼現到現值的方式來估算Shopify Inc.(紐交所:SHOP)的內在價值。我們的分析將使用貼現現金流量(DCF)模型。聽起來可能很複雜,但實際上它非常簡單!
Companies can be valued in a lot of ways, so we would point out that a DCF is not perfect for every situation. If you still have some burning questions about this type of valuation, take a look at the Simply Wall St analysis model.
公司可以用很多種方式進行估值,因此我們指出DCF並不適用於每一種情況。 如果您仍然對這種估值方法有疑問,請查看Simply Wall St分析模型。
The Model
模型
We use what is known as a 2-stage model, which simply means we have two different periods of growth rates for the company's cash flows. Generally the first stage is higher growth, and the second stage is a lower growth phase. To start off with, we need to estimate the next ten years of cash flows. Where possible we use analyst estimates, but when these aren't available we extrapolate the previous free cash flow (FCF) from the last estimate or reported value. We assume companies with shrinking free cash flow will slow their rate of shrinkage, and that companies with growing free cash flow will see their growth rate slow, over this period. We do this to reflect that growth tends to slow more in the early years than it does in later years.
我們採用的是所謂的2階段模型,這意味着我們有兩個不同的現金流增長期。普遍情況下,第一階段是高增長,第二階段是低增長。首先,我們需要估計未來十年的現金流。在可能的情況下,我們使用分析師的估計,但當這些不可得時,我們從上一個估計或報告價值中推斷出前面的自由現金流(FCF)。我們假設自由現金流縮減的公司將減少其縮減率,而自由現金流增長的公司在此期間將看到其增長率放緩。我們這樣做是爲了反映增長在早期年份比後期年份更容易放緩。
Generally we assume that a dollar today is more valuable than a dollar in the future, and so the sum of these future cash flows is then discounted to today's value:
通常我們認爲今天的一美元比未來的一美元更有價值,因此這些未來的現金流的總和被貼現到今天的價值。
10-year free cash flow (FCF) estimate
10年自由現金流 (FCF) 預估值
| 2025 | 2026 | 2027 | 2028 | 2029 | 2030 | 2031 | 2032 | 2033 | 2034 | |
| Levered FCF ($, Millions) | US$1.68b | US$2.37b | US$3.11b | US$3.91b | US$4.50b | US$5.02b | US$5.46b | US$5.83b | US$6.15b | US$6.43b |
| Growth Rate Estimate Source | Analyst x20 | Analyst x6 | Analyst x3 | Analyst x3 | Est @ 15.32% | Est @ 11.44% | Est @ 8.72% | Est @ 6.82% | Est @ 5.49% | Est @ 4.56% |
| Present Value ($, Millions) Discounted @ 7.3% | US$1.6k | US$2.1k | US$2.5k | US$2.9k | US$3.2k | US$3.3k | US$3.3k | US$3.3k | US$3.3k | US$3.2k |
| 2025 | 2026 | 2027 | 2028 | 2029 | 2030 | 2031 | 2032 | 2033 | 2034 | |
| 槓桿自由現金流 ($, 百萬) | 16.8億美元 | 23.7億美元 | 31.1億美元 | 39.1億美元 | 45億美元。 | 50.2億美元 | 54.6億美元 | 58.3億美元 | 61.5億美元 | 64.3億美元 |
| 創業板增長率預測來源 | 20位分析師 | 分析師x6 | 分析師x3 | 分析師x3 | 估計爲15.32% | 估計爲11.44% | 估值爲8.72% | 以6.82%計, | 以5.49%計, | 以4.56%計, |
| 以7.3%的折現率折現的現值($,百萬) | US$1.6k | 2.1k美元 | 2.5千美元 | 2.9k美元 | 美元3.2千 | 3.3千美元 | 3.3千美元 | 3.3千美元 | 3.3千美元 | 美元3.2千 |
("Est" = FCF growth rate estimated by Simply Wall St)
Present Value of 10-year Cash Flow (PVCF) = US$29b
("Est" = FCF增長率估計由Simply Wall St)
10年現金流的現值(PVCF)=29億美元
After calculating the present value of future cash flows in the initial 10-year period, we need to calculate the Terminal Value, which accounts for all future cash flows beyond the first stage. The Gordon Growth formula is used to calculate Terminal Value at a future annual growth rate equal to the 5-year average of the 10-year government bond yield of 2.4%. We discount the terminal cash flows to today's value at a cost of equity of 7.3%.
在計算了最初10年未來現金流的現值後,我們需要計算終值,它代表了第一階段之後的所有未來現金流。 高登增長模型用於計算未來年增長率與10年期政府債券收益率的5年平均值相等的終值。 我們以7.3%的權益成本來折現終端現金流至今日的價值。
Terminal Value (TV)= FCF2034 × (1 + g) ÷ (r – g) = US$6.4b× (1 + 2.4%) ÷ (7.3%– 2.4%) = US$133b
期末價值(TV)= FCF2034 ×(1 + g)÷(r-g)= 64億美元×(1 + 2.4%)÷(7.3%-2.4%)= 1330億美元
Present Value of Terminal Value (PVTV)= TV / (1 + r)10= US$133b÷ ( 1 + 7.3%)10= US$66b
期末價值的現值(PVTV)= TV /(1 + r)10= 1330億美元÷(1 + 7.3%)10= 660億美元
The total value, or equity value, is then the sum of the present value of the future cash flows, which in this case is US$94b. The last step is to then divide the equity value by the number of shares outstanding. Compared to the current share price of US$64.2, the company appears about fair value at a 12% discount to where the stock price trades currently. Valuations are imprecise instruments though, rather like a telescope - move a few degrees and end up in a different galaxy. Do keep this in mind.
總價值或股權價值是未來現金流的現值之和,本例中爲9,400,000,000美元。最後一步是將股權價值除以已發行股份的數量。與當前股價64.2美元相比,公司看起來接近公平價值,優惠12%。估值是不精確的儀器,就像望遠鏡一樣,稍微動一下,就會進入另一個星系。請記住這一點。
The Assumptions
假設
We would point out that the most important inputs to a discounted cash flow are the discount rate and of course the actual cash flows. You don't have to agree with these inputs, I recommend redoing the calculations yourself and playing with them. The DCF also does not consider the possible cyclicality of an industry, or a company's future capital requirements, so it does not give a full picture of a company's potential performance. Given that we are looking at Shopify as potential shareholders, the cost of equity is used as the discount rate, rather than the cost of capital (or weighted average cost of capital, WACC) which accounts for debt. In this calculation we've used 7.3%, which is based on a levered beta of 1.073. Beta is a measure of a stock's volatility, compared to the market as a whole. We get our beta from the industry average beta of globally comparable companies, with an imposed limit between 0.8 and 2.0, which is a reasonable range for a stable business.
我們指出,折現現金流最重要的輸入是折現率和實際現金流。您不必同意這些輸入,我建議您重新進行計算並進行調整。DCF還不考慮行業的可能週期性,或公司未來的資本需求,因此它不能給出公司潛在績效的完整圖畫。鑑於我們正在考慮Shopify作爲潛在的股東,因此使用權益成本作爲折現率,而不是考慮債務的資本成本(或加權平均資本成本WACC)。 在這個計算中,我們使用了7.3%,這是基於1.073的偏倚貝塔。貝塔是衡量股票波動性的指標,與整個市場相比較。我們從全球可比公司的行業平均貝塔中獲得貝塔,強制施加在0.8和2.0之間的上限,這是一個穩定業務的合理範圍。
Looking Ahead:
展望未來:
Whilst important, the DCF calculation ideally won't be the sole piece of analysis you scrutinize for a company. DCF models are not the be-all and end-all of investment valuation. Rather it should be seen as a guide to "what assumptions need to be true for this stock to be under/overvalued?" For instance, if the terminal value growth rate is adjusted slightly, it can dramatically alter the overall result. For Shopify, there are three essential aspects you should further examine:
雖然重要,但DCF計算理論上不應是您仔細研究公司的唯一分析。DCF模型並不是投資估值的全部和結局。而它應該被看作是“這隻股票被低估/高估需要什麼假設?”的指導。例如,如果終端價值增長率略微調整,則可能會極大地改變整體結果。對於Shopify而言,有三個關鍵方面需要進一步檢查:
- Financial Health: Does SHOP have a healthy balance sheet? Take a look at our free balance sheet analysis with six simple checks on key factors like leverage and risk.
- Management:Have insiders been ramping up their shares to take advantage of the market's sentiment for SHOP's future outlook? Check out our management and board analysis with insights on CEO compensation and governance factors.
- Other Solid Businesses: Low debt, high returns on equity and good past performance are fundamental to a strong business. Why not explore our interactive list of stocks with solid business fundamentals to see if there are other companies you may not have considered!
- 財務狀況:SHOP財務平衡狀況良好嗎? 通過六個關鍵因素的自由資金和風險分析,了解我們的免費資產負債表分析。
- 管理:內部人是否在增加股份以利用市場對SHOP未來前景的看法?查看我們的管理和董事會分析,了解CEO薪酬和治理因素的見解。
- 其他優秀企業:低負債,高股本回報率和良好的過去業績是構建強大企業基礎的基礎。爲什麼不探索我們交互式的股票列表,其中包括具有堅實業務基礎的其他公司?
PS. The Simply Wall St app conducts a discounted cash flow valuation for every stock on the NYSE every day. If you want to find the calculation for other stocks just search here.
PS。Simply Wall St應用程序每天爲紐約證券交易所的每隻股票進行折現現金流估值。如果您想查找其他股票的計算,請在此處搜索。
Have feedback on this article? Concerned about the content? Get in touch with us directly. Alternatively, email editorial-team (at) simplywallst.com.
This article by Simply Wall St is general in nature. We provide commentary based on historical data and analyst forecasts only using an unbiased methodology and our articles are not intended to be financial advice. It does not constitute a recommendation to buy or sell any stock, and does not take account of your objectives, or your financial situation. We aim to bring you long-term focused analysis driven by fundamental data. Note that our analysis may not factor in the latest price-sensitive company announcements or qualitative material. Simply Wall St has no position in any stocks mentioned.
對本文有反饋?對內容感到擔憂?請直接與我們聯繫。或者,發送電子郵件至editorial-team (at) simplywallst.com。
這篇文章是Simply Wall St的一般性文章。我們根據歷史數據和分析師預測提供評論,只使用公正的方法論,我們的文章並不意味着提供任何金融建議。文章不構成買賣任何股票的建議,也不考慮您的目標或您的財務狀況。我們的目標是帶給您基本數據驅動的長期關注分析。請注意,我們的分析可能不考慮最新的價格敏感公司公告或定性材料。Simply Wall St沒有任何股票頭寸。
Have feedback on this article? Concerned about the content? Get in touch with us directly. Alternatively, email editorial-team@simplywallst.com
對本文有反饋?對內容感到擔憂?請直接與我們聯繫。或者,發送電子郵件至editorial-team@simplywallst.com。