
Shanxi Meijin EnergyLtd (SZSE:000723 Investor Five-year Losses Grow to 53% as the Stock Sheds CN¥1.1b This Past Week
Shanxi Meijin EnergyLtd (SZSE:000723 Investor Five-year Losses Grow to 53% as the Stock Sheds CN¥1.1b This Past Week
Generally speaking long term investing is the way to go. But along the way some stocks are going to perform badly. Zooming in on an example, the Shanxi Meijin Energy Co.,Ltd. (SZSE:000723) share price dropped 54% in the last half decade. That's not a lot of fun for true believers. We also note that the stock has performed poorly over the last year, with the share price down 43%. The falls have accelerated recently, with the share price down 30% in the last three months.
一般來說,長期投資是素質好的選擇。但在此過程中,某些股票表現不佳。以美錦能源(SZSE:000723)爲例,該公司股價在過去的半個十年中下跌了54%。對於真正的信仰者來說,這不是一件有趣的事情。我們還注意到,該股過去一年的表現也不佳,股價下跌了43%。近期,該股的跌幅加劇,股價在過去三個月下跌了30%。
After losing 5.4% this past week, it's worth investigating the company's fundamentals to see what we can infer from past performance.
在過去的一週中,該公司虧損了5.4%,值得調查公司的基本面,以了解我們可以從過去的表現中推斷出什麼。
While markets are a powerful pricing mechanism, share prices reflect investor sentiment, not just underlying business performance. One flawed but reasonable way to assess how sentiment around a company has changed is to compare the earnings per share (EPS) with the share price.
雖然市場是一個強大的定價機制,但股價反映了投資者情緒,不僅僅是基本業績。一種有缺陷但合理的評估公司周圍情緒如何變化的方法是將每股收益(EPS)與股價進行比較。
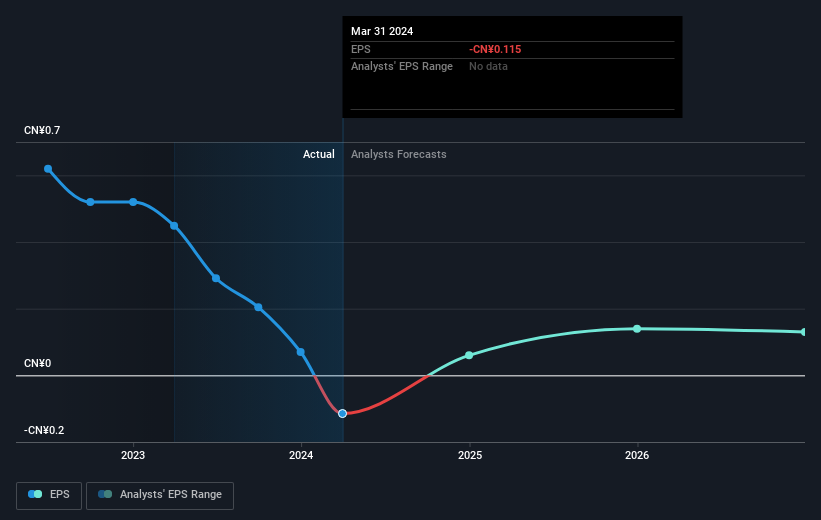
In the last half decade Shanxi Meijin EnergyLtd saw its share price fall as its EPS declined below zero. At present it's hard to make valid comparisons between EPS and the share price. However, we can say we'd expect to see a falling share price in this scenario.
在過去的半個十年中,隨着每股收益降至低於零,美錦能源有限公司的股價下跌了。目前很難對每股收益和股價進行有效比較。然而,我們可以說,在這種情況下,我們預計看到股價下跌。
The image below shows how EPS has tracked over time (if you click on the image you can see greater detail).
下圖顯示了EPS隨時間的變化情況(如果您單擊該圖像,則可以查看更多詳細信息)。
Dive deeper into Shanxi Meijin EnergyLtd's key metrics by checking this interactive graph of Shanxi Meijin EnergyLtd's earnings, revenue and cash flow.
通過查看美錦能源有限公司的收入、營業收入和現金流的交互式圖表,更深入地了解其關鍵指標。
A Different Perspective
不同的觀點
While the broader market lost about 19% in the twelve months, Shanxi Meijin EnergyLtd shareholders did even worse, losing 43%. However, it could simply be that the share price has been impacted by broader market jitters. It might be worth keeping an eye on the fundamentals, in case there's a good opportunity. Unfortunately, last year's performance may indicate unresolved challenges, given that it was worse than the annualised loss of 9% over the last half decade. We realise that Baron Rothschild has said investors should "buy when there is blood on the streets", but we caution that investors should first be sure they are buying a high quality business. Shareholders might want to examine this detailed historical graph of past earnings, revenue and cash flow.
雖然整個市場在過去十二個月中損失了約19%,但美錦能源有限公司的股東表現得更差,虧損43%。但是,股價可能僅受到市場的影響,因此值得關注基本面情況,以尋找良好的機會。不幸的是,去年的表現可能表明存在未解決的挑戰,因爲它比過去半個十年的年化虧損率9%更差。我們知道,巴倫·羅斯柴爾德曾說過投資者應該「在街道上有血液時買入」,但我們提醒投資者首先確保他們正在購買一個高質量的企業。股東們可能想要查看過去收益、營業收入和現金流的詳細歷史圖表。
For those who like to find winning investments this free list of undervalued companies with recent insider purchasing, could be just the ticket.
對於那些喜歡尋找獲勝投資的人來說,最近有內部購買的低估公司免費列表可能是一個很好的選擇。
Please note, the market returns quoted in this article reflect the market weighted average returns of stocks that currently trade on Chinese exchanges.
請注意,本文引用的市場回報反映了目前在中國交易所上市的股票的市場加權平均回報。
Have feedback on this article? Concerned about the content? Get in touch with us directly. Alternatively, email editorial-team (at) simplywallst.com.
This article by Simply Wall St is general in nature. We provide commentary based on historical data and analyst forecasts only using an unbiased methodology and our articles are not intended to be financial advice. It does not constitute a recommendation to buy or sell any stock, and does not take account of your objectives, or your financial situation. We aim to bring you long-term focused analysis driven by fundamental data. Note that our analysis may not factor in the latest price-sensitive company announcements or qualitative material. Simply Wall St has no position in any stocks mentioned.
對本文有任何反饋?對內容有任何疑慮?請直接與我們聯繫。或者,發送電子郵件至editorial-team@simplywallst.com。
這篇文章是Simply Wall St的一般性文章。我們根據歷史數據和分析師預測提供評論,只使用公正的方法論,我們的文章並不意味着提供任何金融建議。文章不構成買賣任何股票的建議,也不考慮您的目標或您的財務狀況。我們的目標是帶給您基本數據驅動的長期關注分析。請注意,我們的分析可能不考慮最新的價格敏感公司公告或定性材料。Simply Wall St沒有任何股票頭寸。
Have feedback on this article? Concerned about the content? Get in touch with us directly. Alternatively, email editorial-team@simplywallst.com
對本文有任何反饋?對內容有任何疑慮?請直接與我們聯繫。或者,發送電子郵件至editorial-team@simplywallst.com。